 Source: pixabay
The dashboard for this analysis is built in Tableau, which can be found here.
Overview - Business problem
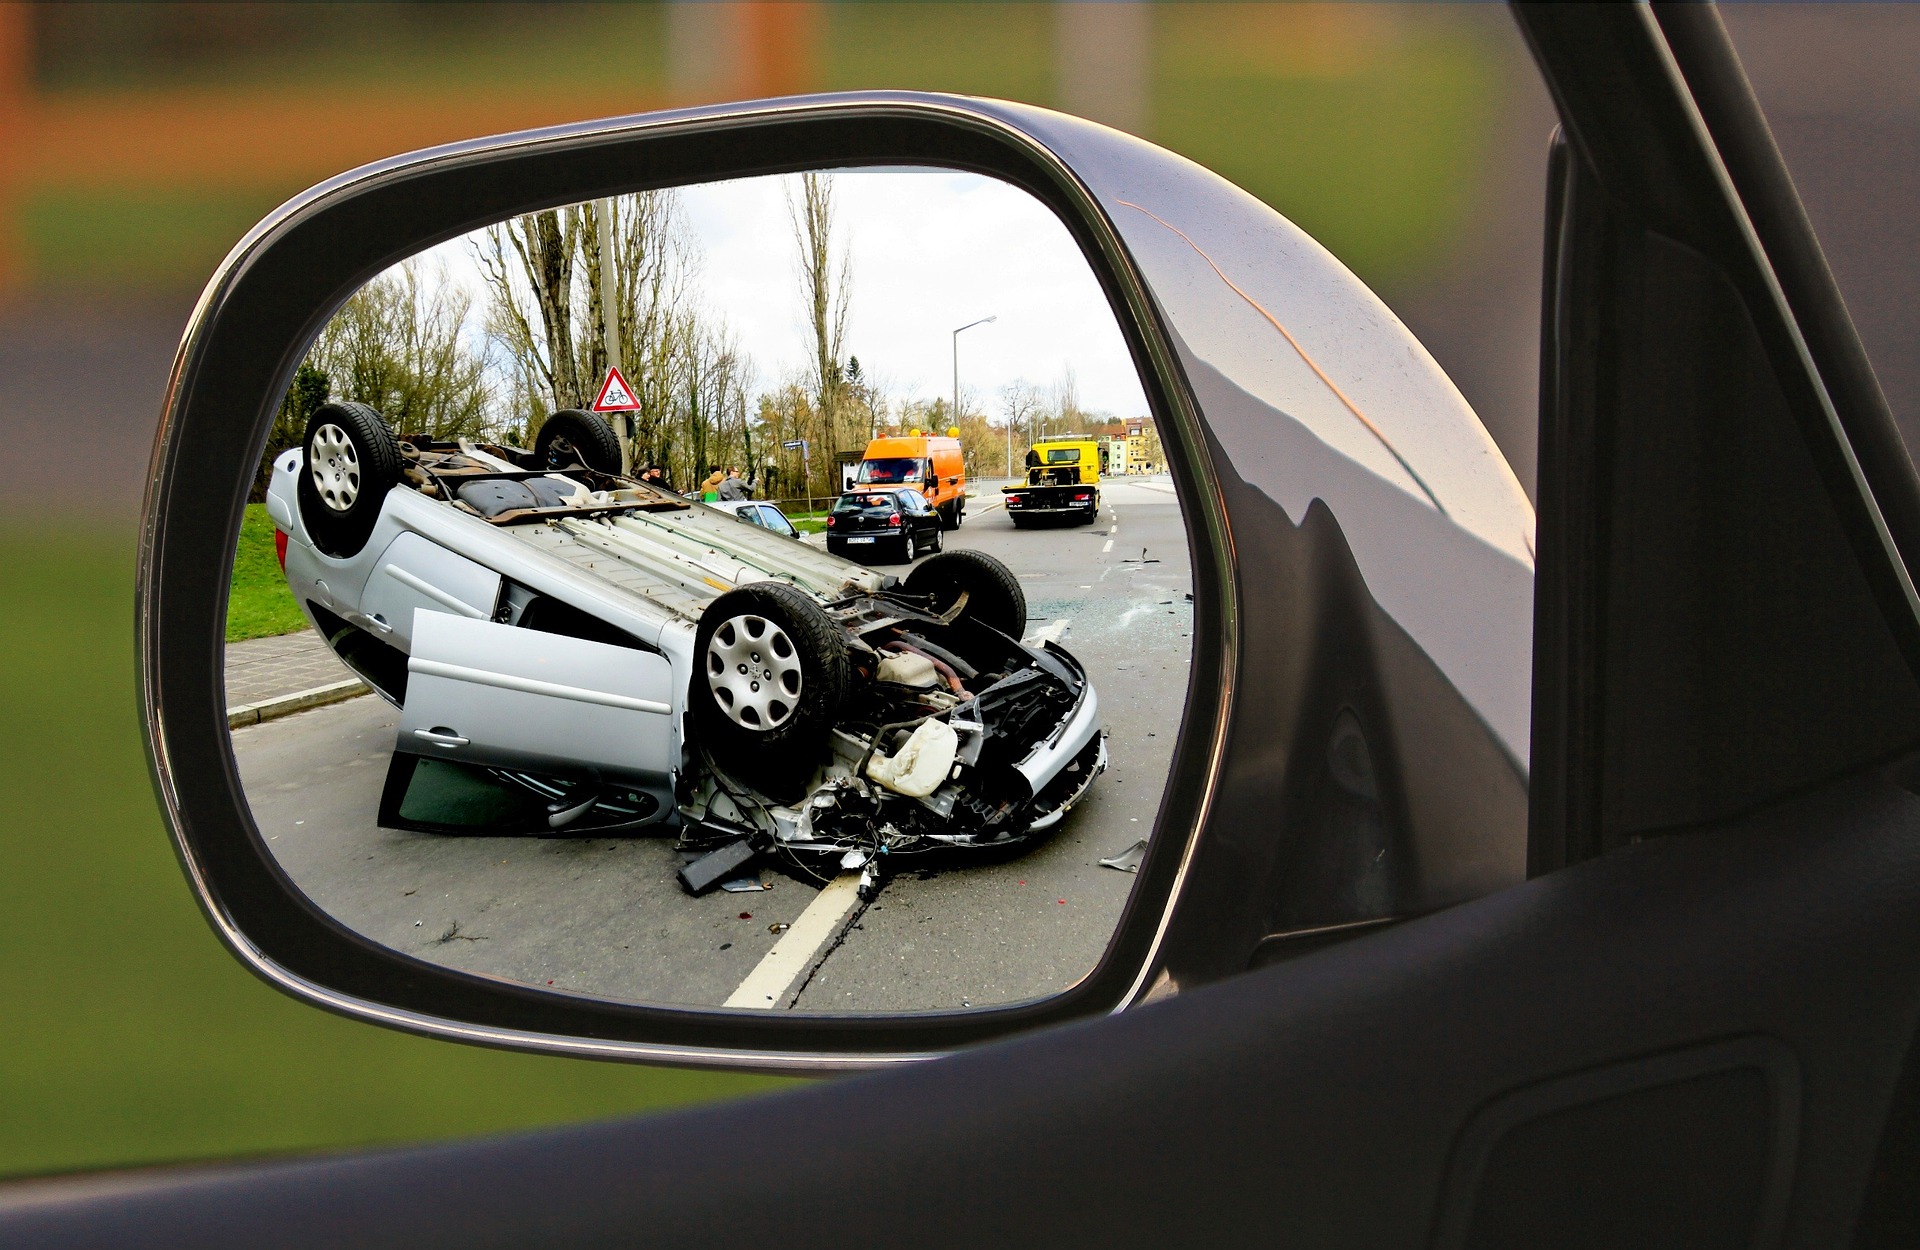
According to WHO, approximately 1.3 million people die each year as a result of road traffic crashes. Between 20 and 50 million more people suffer non-fatal injuries, with many incurring a disability as a result of their injury. In addition, road traffic crashes cost most countries 3% of their gross domestic product. This worldwide-phenomenon has been quite alarming as private transportation ownership increases, resulting in volume rise of vehicles on the road as well as traffic accidents. It is therefore critical to analyze and derive insights on what factors that could potentially influence the road accident events. These insights could be used for road accidents prevention measures.
Goal
The objective of this road safety analysis to help analyze the influential factors causing traffic accidents, locate accident hot-spots and perform supervised machine learning for predicting accident severity. Python and Tableau are used for data visualization and analysis presentation. Personally, as a professional in HSE area (Health Safety Environment), I selected this analysis subject intentionally to add values and insights to my current knowledge.
Data
- Open source road crash and casualties data from 2021 in South Australia collected by Department for Infrastructure and Transport. Cleaned and merged data results in 21,242 cases of traffic accidents. It can be found here.
- Data information and dictionary
- Geojson of South Australian suburb boundaries
Process
This analysis, therefore, could be divided into two parts:
- Part 1: Exploration
- Part 2: Modeling
The methodology for this purpose is called CRISP-DM(Cross Industry Standard Process for Data Mining, without deployment) is used to during this analysis process.
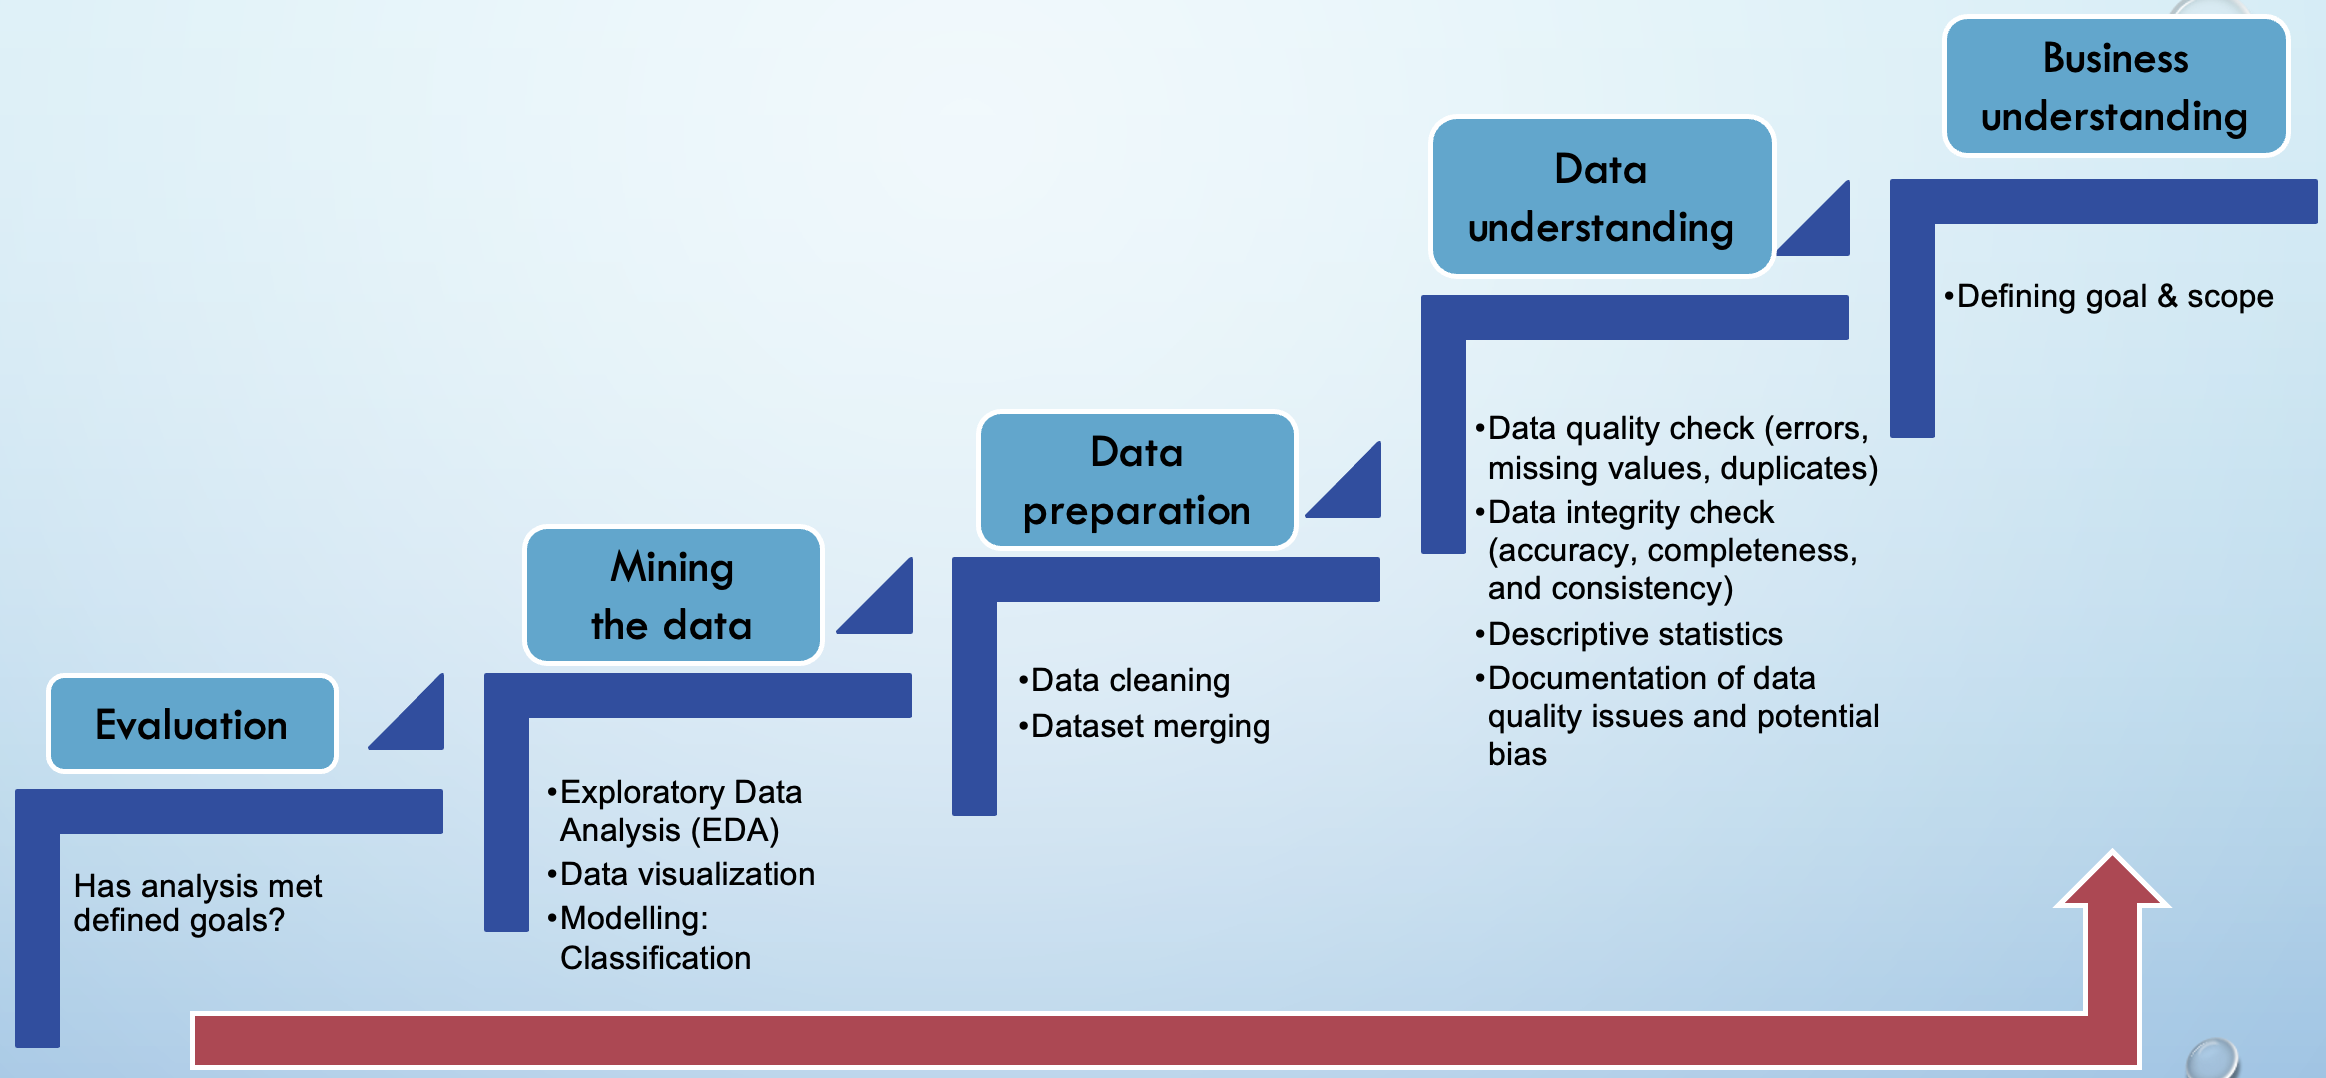 CRISP-DM Methodology. Source by author.
- Business understanding
- Data understanding There are 3 datasets for this analysis: ‘crash’, ‘unit’ and ‘casualty’. I started this process by reading the data dictionary provided and comparing with the content of the datasets. Data quality and integrity check were then performed for each dataset. Each step is documented as it necessary for the data cleaning.
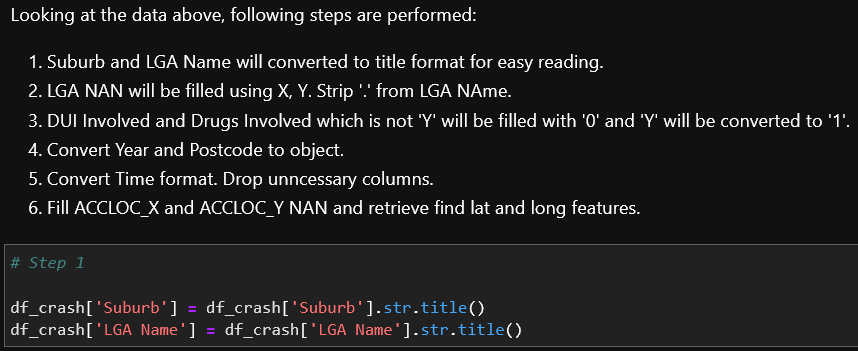
- Data preparation Based on the previous checks, data cleaning was performed which include removing duplicates, handling missing values, error typing of records and outliers. Finally, datasets were merged. Documentation of performed steps were included in the Jupyter notebook, such as below:
- Mining the data
- Here the data exploratory began, divided into several categories:
- - General accident distribution
- - Time-based analysis: hourly, daily and monthly
- - People-based analysis: sex, age, alcohol and drugs involvement
- - Weather-based analysis
- - Spatial analysis
 Sample of data preparation documentation
Part 1: Data exploration
Accident distribution - How severe are accidents are on the road?
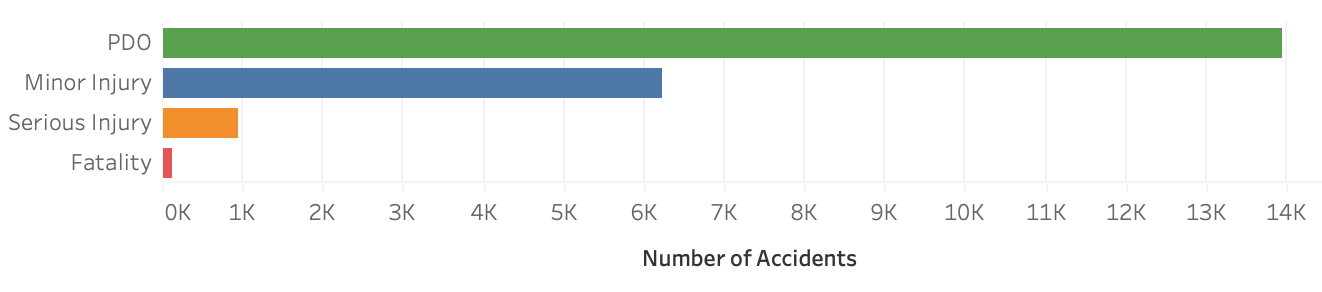
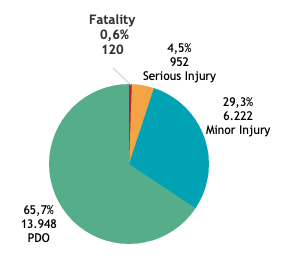 Accident distribution by accident severity
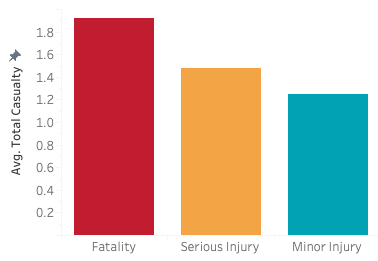 Average total casualty by accident severity
Pie chart shows property damage with no casualty (PDO) as the lightest level of accident severity accounts for 65.7% of the reported cases. The rest of the cases (34.4%) were divided into three higher severity levels; minor injury, serious injury and death (fatality). It can be seen that death or fatality accounts only for 0.6% of the reported accident cases. However, compared to serious and minor injury groups, it takes the highest of number casualty in average.
Time-based analysis: When do most accident happens, in hourly basis?
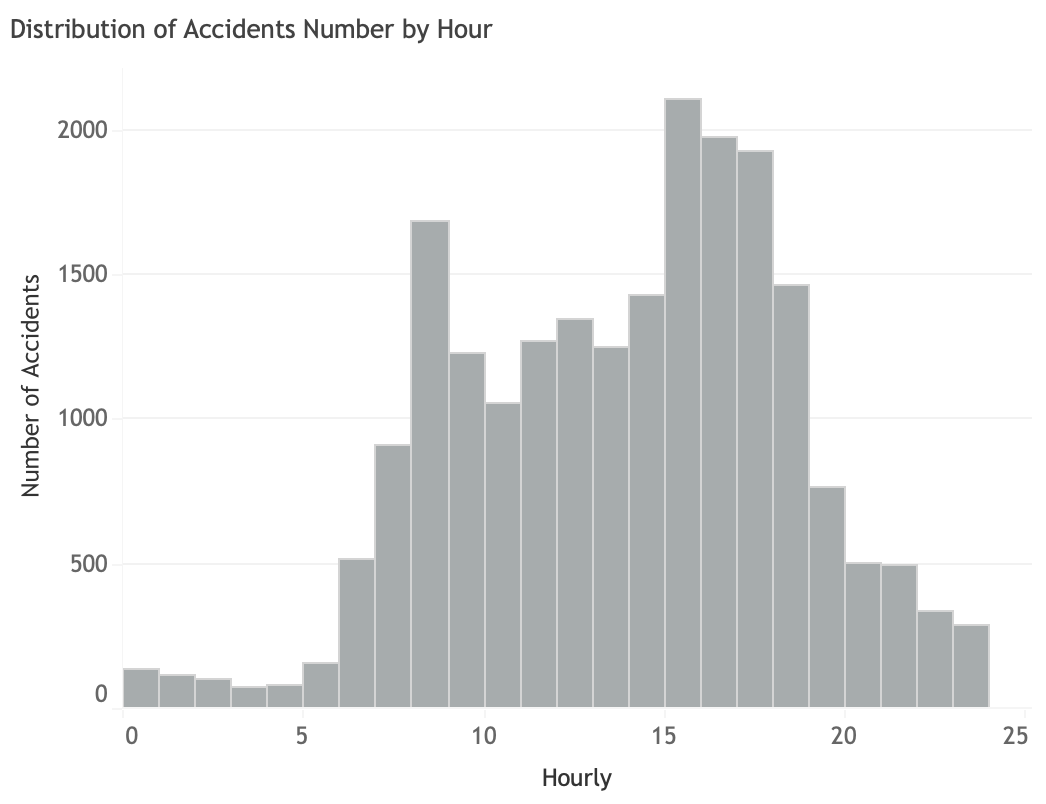 Accident distribution by hour
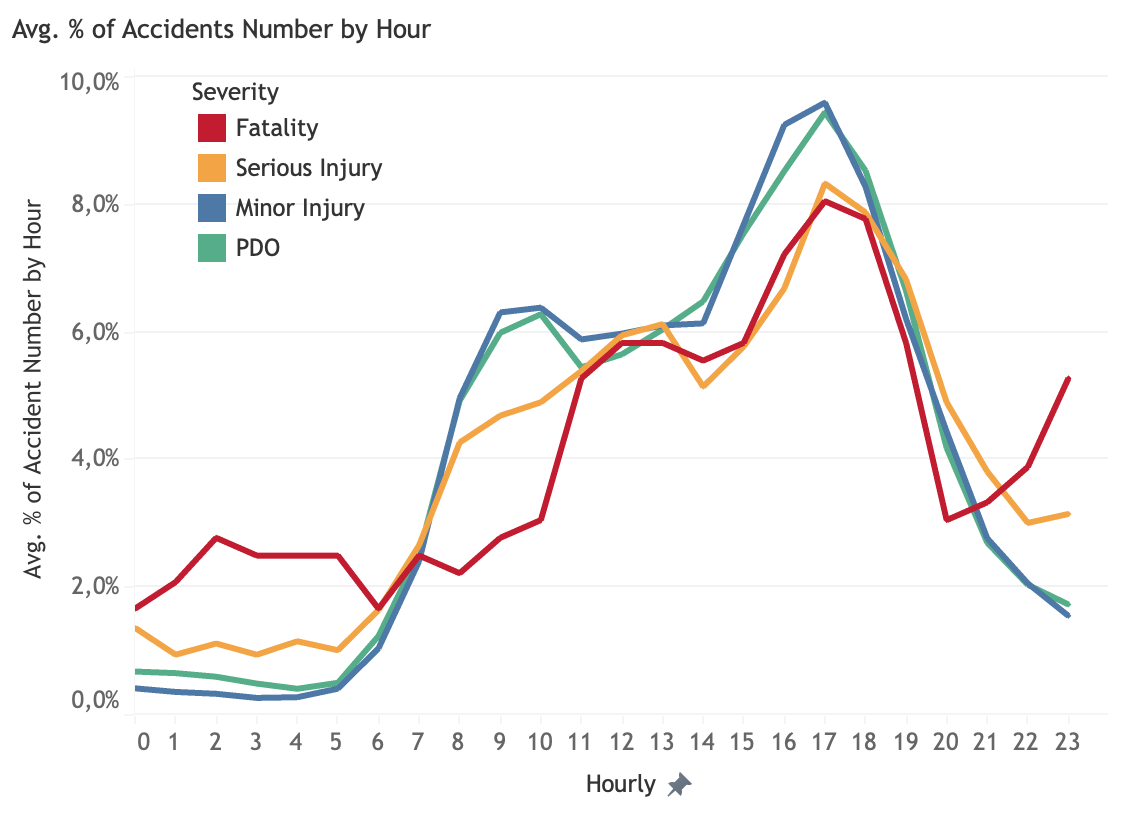 Percentage of number of accidents by hour
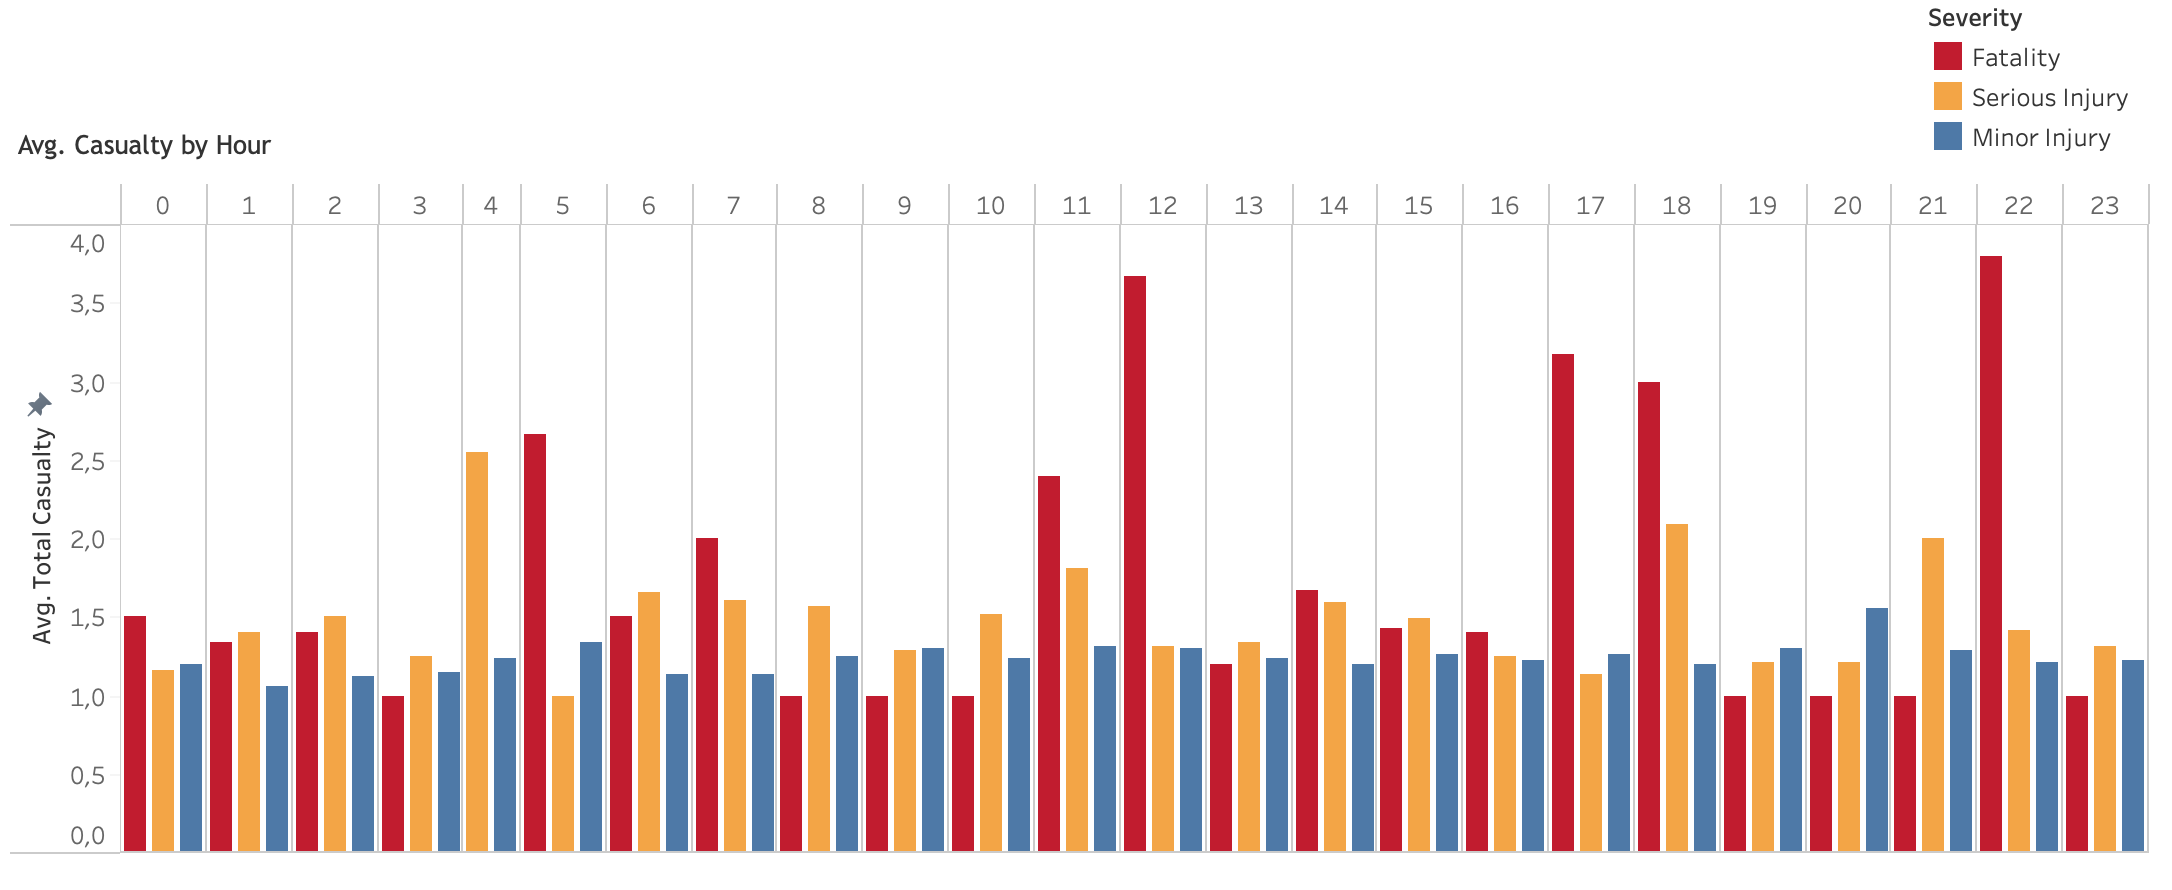 Average total casualty by hour
In general, accidents occurrence starts to rise in the morning rush-hour, at 07:00 and reaches its peak during afternoon rush-hour, from 15:00 to 17:00. It is the decreasing afterwards. However, a little bit different patterns is shown by fatality category. Fatality cases are shown to be high since midnight at 02:00 and steadily increases during morning rush-hour until reaches its peaks in the mid-day at 12:00 and in the afternoon rush-hour. While it decreases after afternoon rush-hour, it climbs again at 21:00. From this pattern, fatality cases mostly happen in these two time frames: least crowded time and crowded time. In terms of average casualty of fatality accidents, there seems to be an hourly pattern that shows peak at 5, 12, 18 and 22.
Time-based analysis: When do most accident happens, in daily basis?
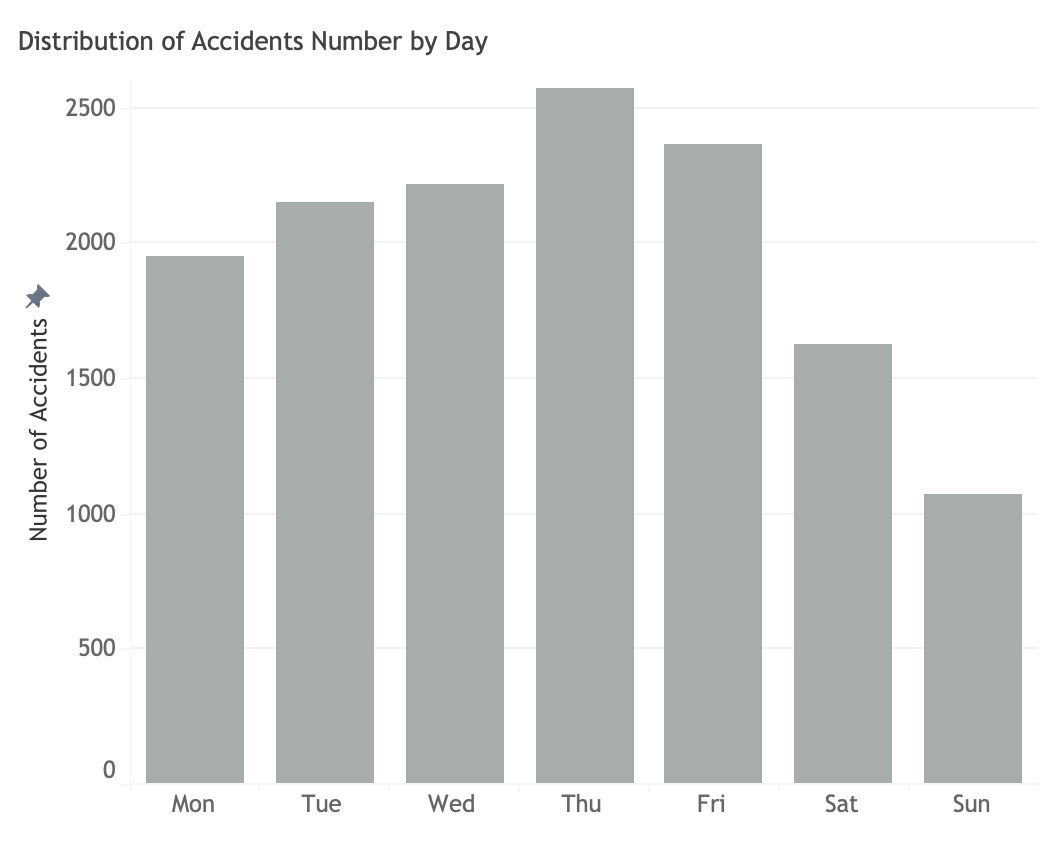 Accident distribution by day
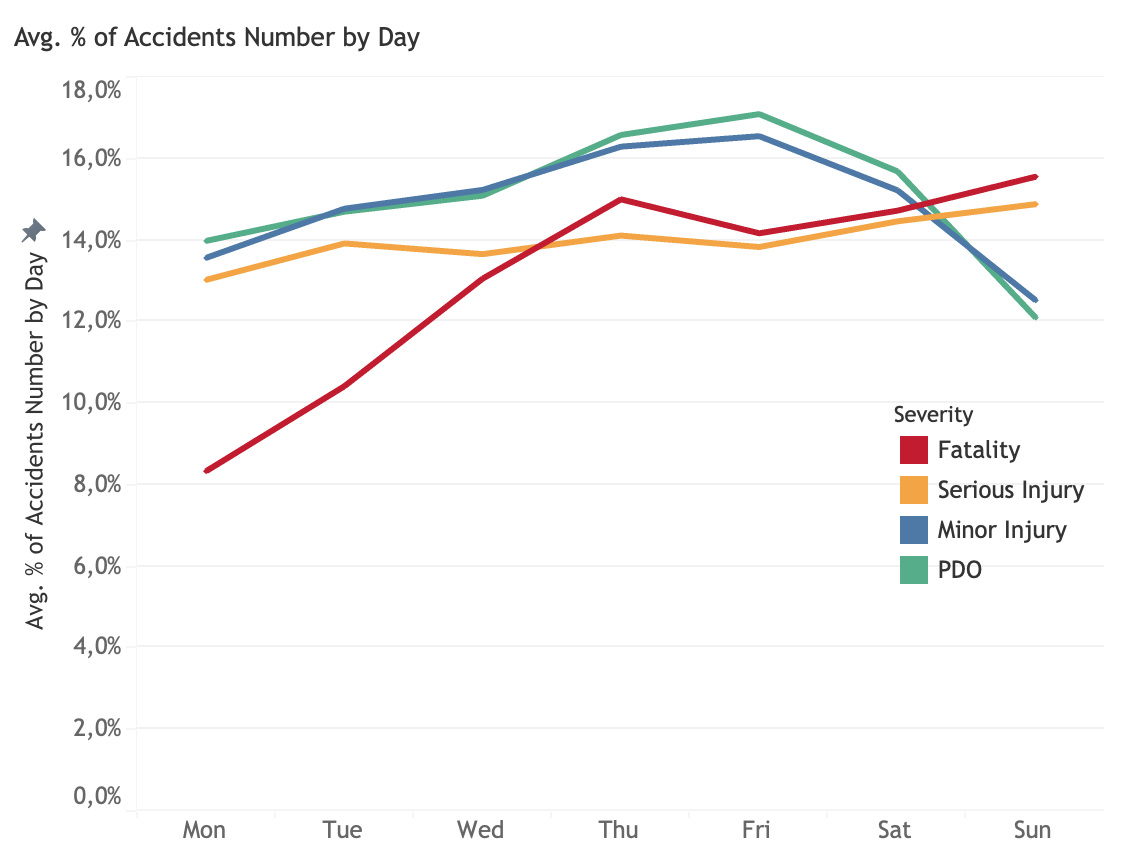 Percentage of number of accidents by day
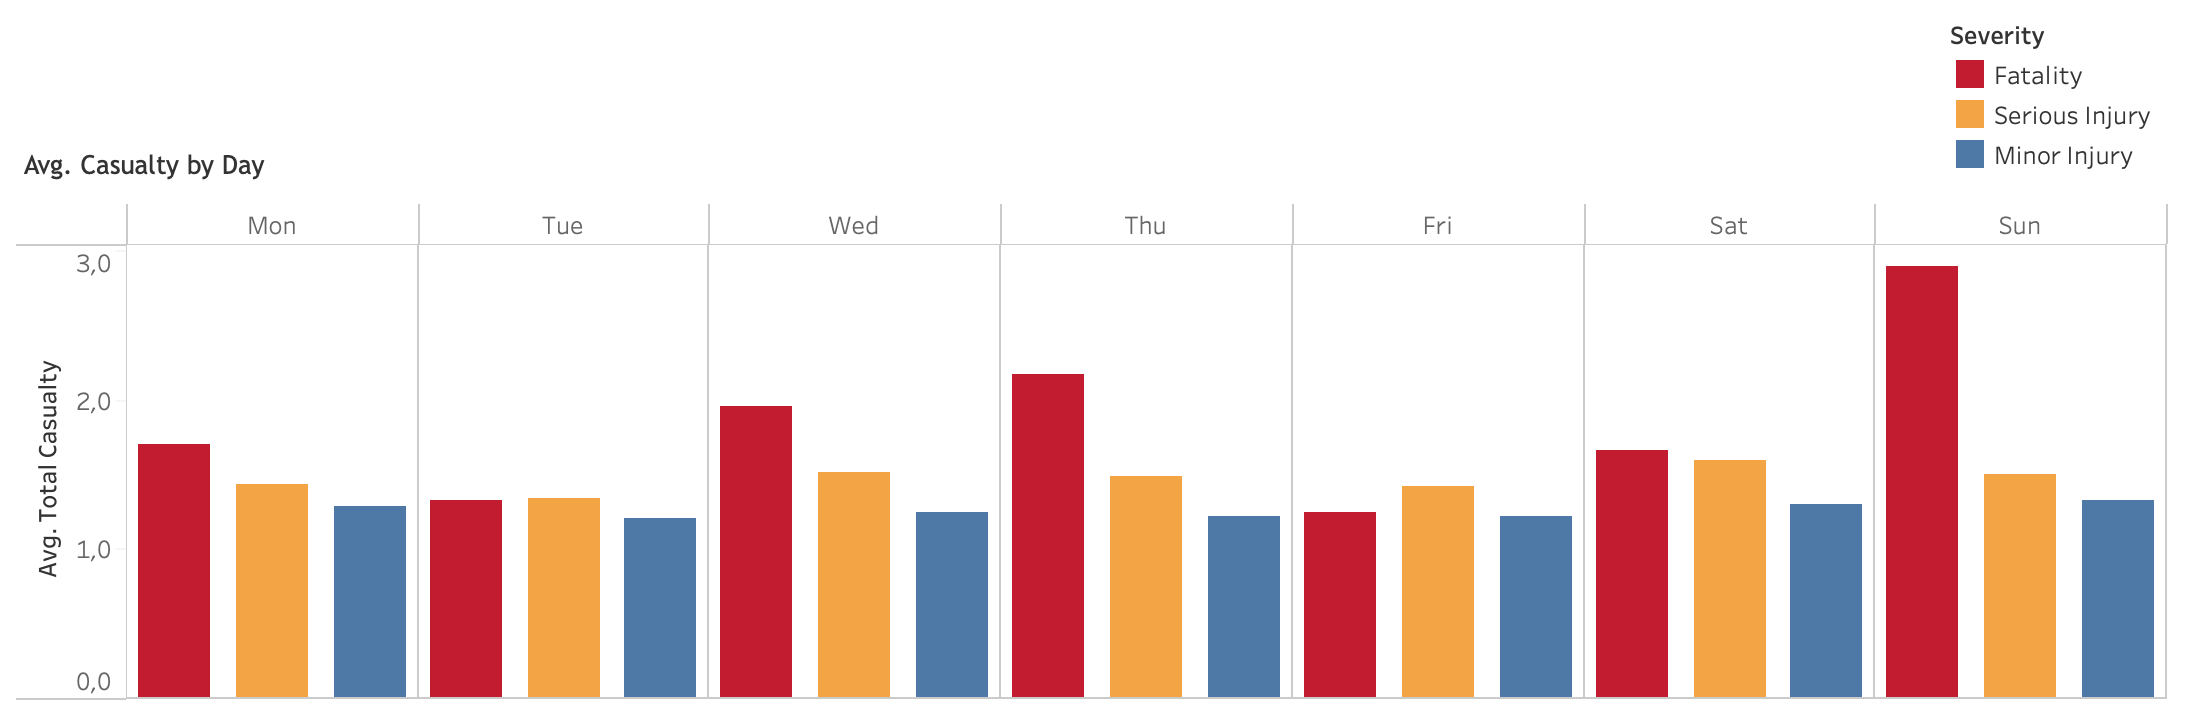 Average total casualty by day
Based on its characteristics, accident occurences of PDO and minor injury group steadily increase from Monday and reach peak on Thursday and decreases afterwards, even during weekend. Accident occurences on serious injury generally remain steady during the whole week. While, fatatality cases rises steadily from Monday and peak on Thursday and increases during weekend.
Generally, average casualty on fatality and serious injury remains stable during weekeday and slightly rise during weekend. Conversely, average casualty on minor injury remains stabil during weekday, but decreases during weekend. From this pattern, there seems to be general behavior occurs during the week: Thursday becomes the day of high number of accidents and high casualty, weekend generally shows lower vehicle volumes but increase fatality cases and fatality casualty.
Time-based analysis: When do most accident happens, in monthly basis?
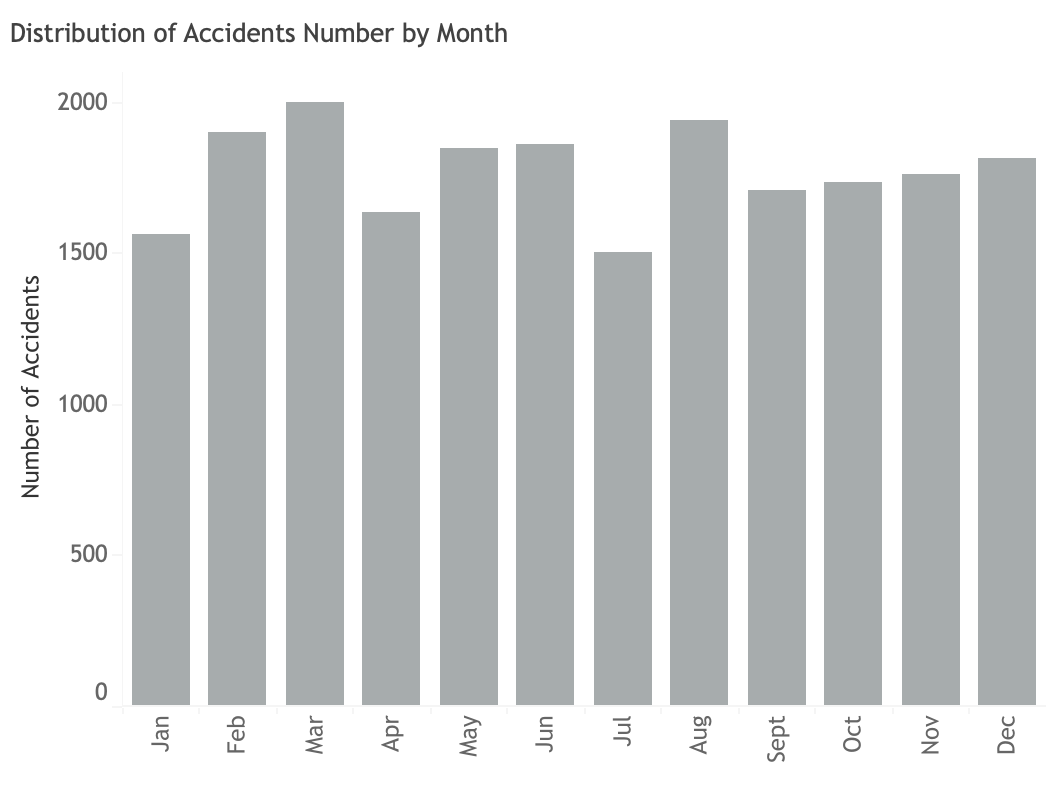 Accident distribution by month
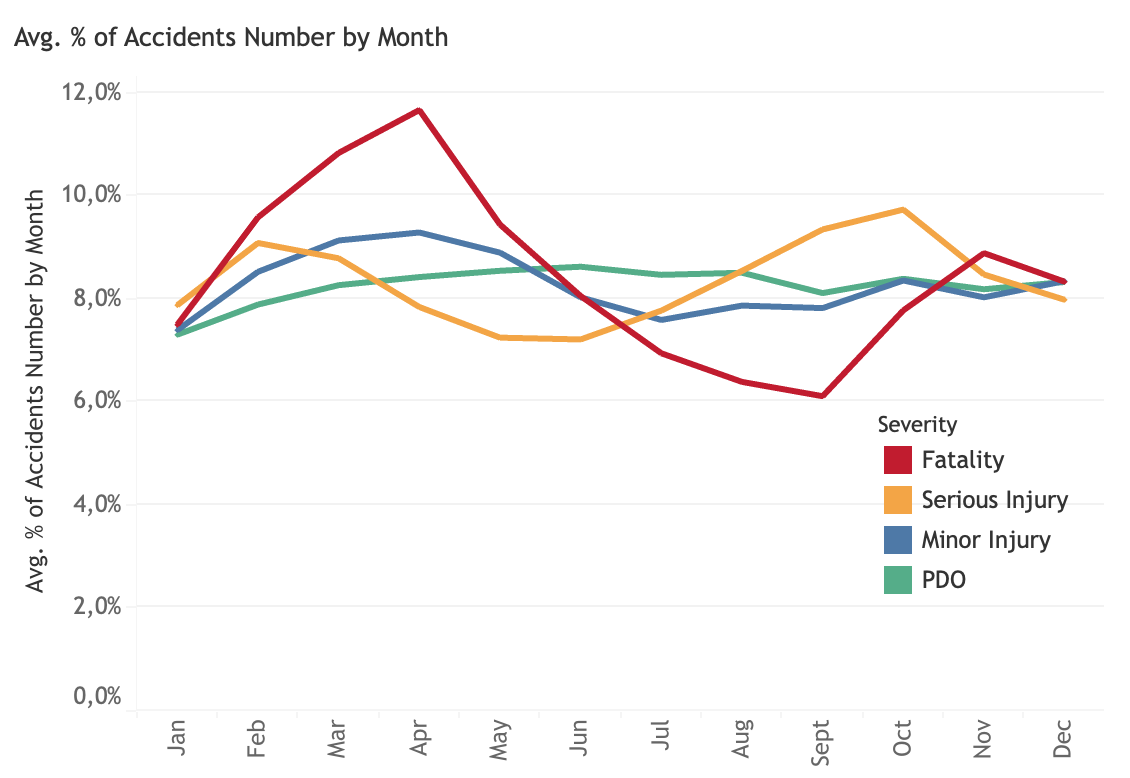 Percentage of number of accidents by month
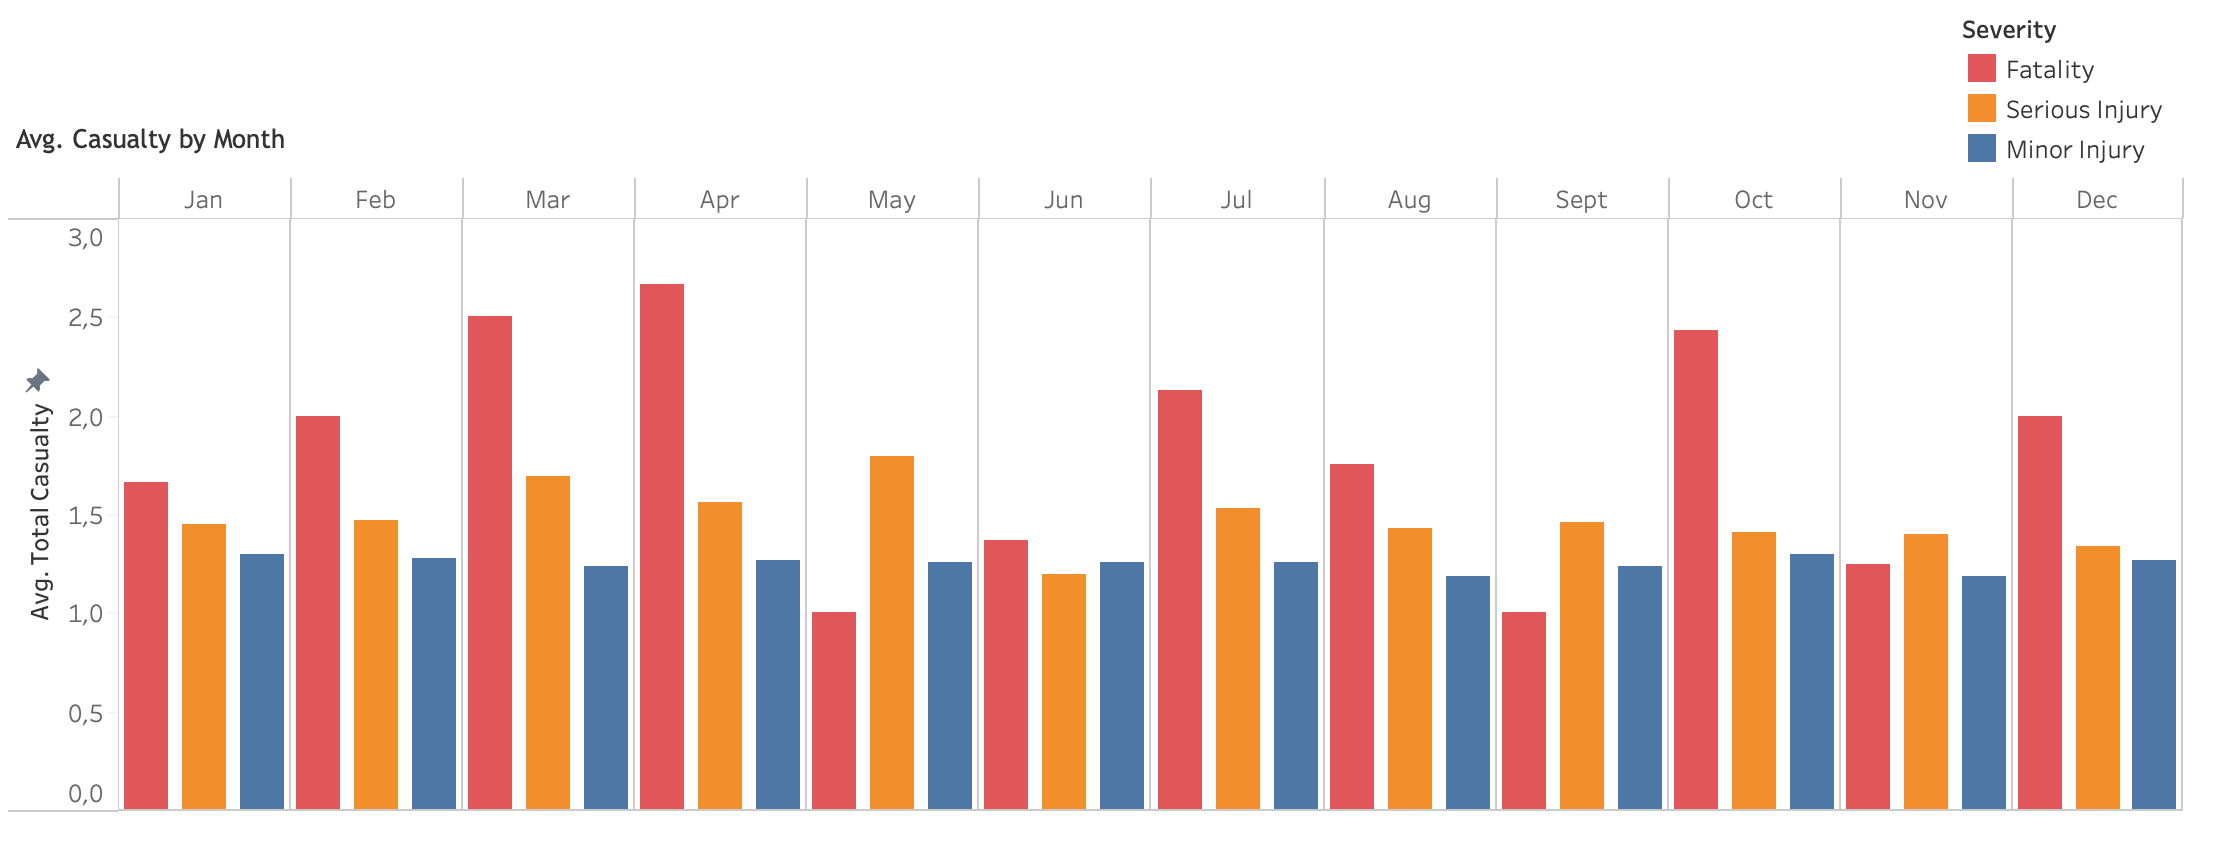 Average total casualty by month
Generally, accident events of property damage and minor injury remains stable during the whole year.However, there seems to be seasonality on serious injury and fatality acidents. Serious injury accidents peak in Q1 (February), decrease afterwards, climb in summer (Q2, June) and reach its highest peak of the year in September (Q3). It decreases steadily during winter (Q4. While, fatality accidents reach its peak of the year in Q1 (March) and then decreases during summer time (Q2). In Q3 (September), it is at its lowest point and rises steadily during winter (Q4).
In terms of average casualty, interestingly, only fatality has seasonality. It increases steadily during Q1 and reach the first peak in April (Q2). The second and third peaks occur in July (Q2) and October (Q3), respectively. This pattern reflects three holidays, Easter, summer and winter holidays.
People-based analysis: Who are at risk? - Sex, alcohol and drugs involvement
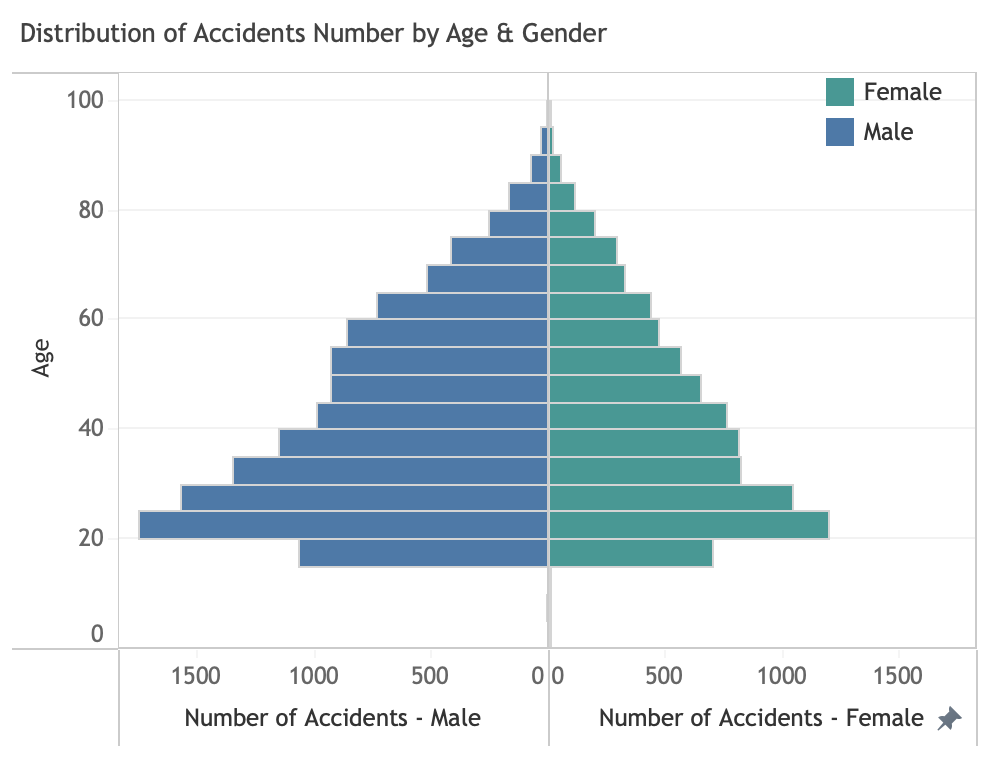 Accident distribution by sex and age
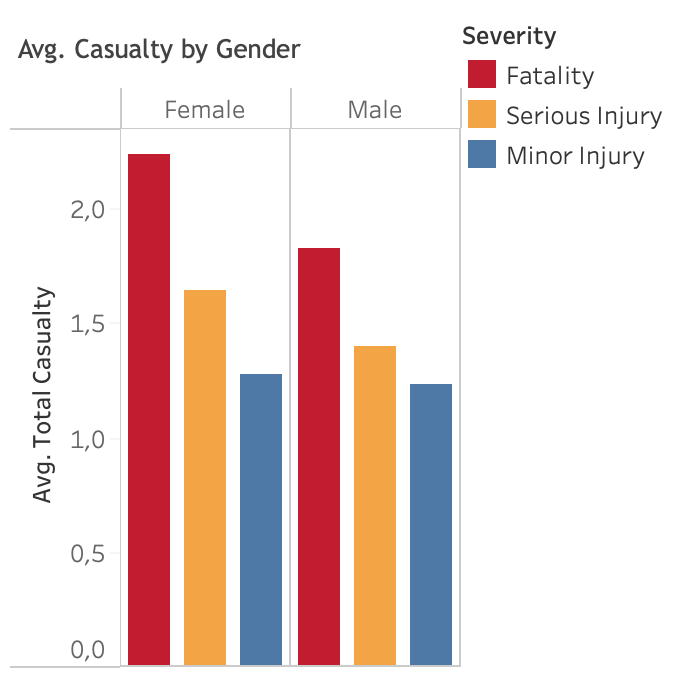 Average total casualty by sex
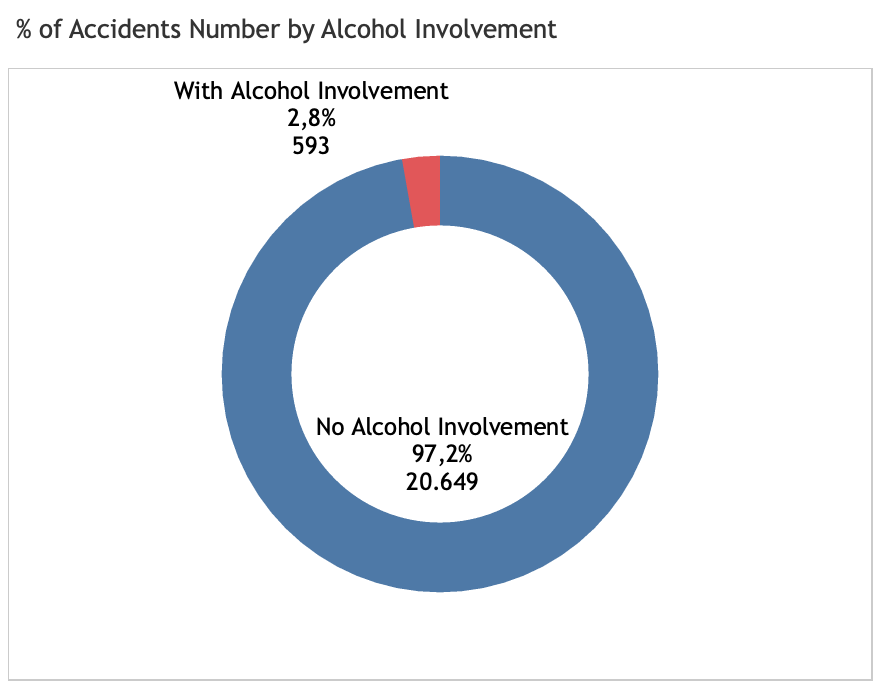
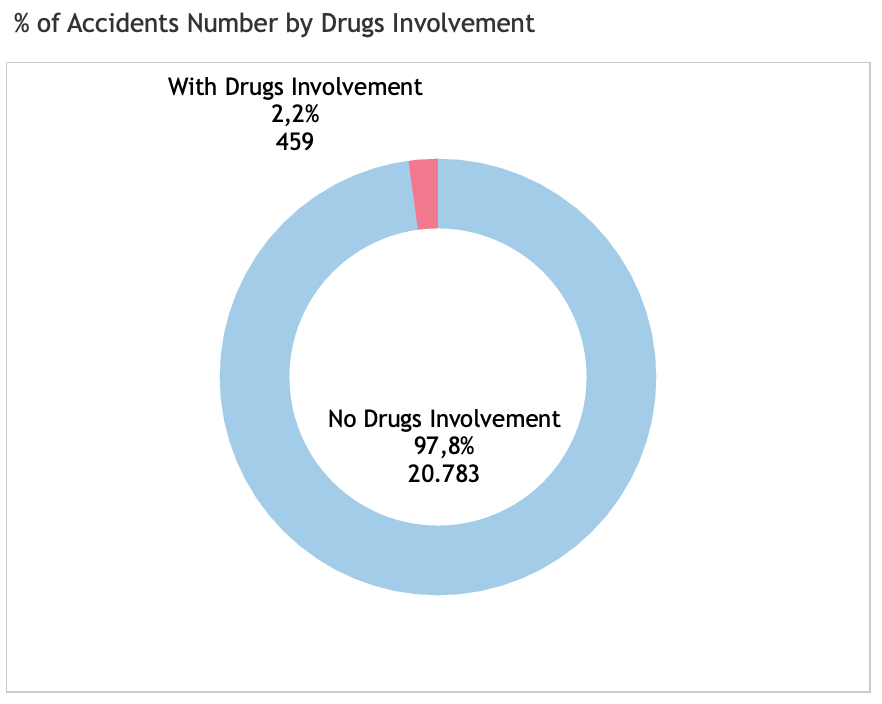 Accident distribution by drugs and alcohol involvement
Ca. 60% of the accidents happens to be male and 40% is female. Both male and female is domintaed by young people from 20-25 years of age. However, in average, death or fatality in female (2.2) is higher compared to that in male (1.8). Surprisingly, in South Australia, involvement of alcohol and drugs play little role in the number of accidents. It might be related to the measures taken by local authority or law enforcement in controlling alcohol and drugs circulation. However, alcohol and drugs involvement increased accident severities of injuries and death (fatality). With alochol involved, number of accidents with fatality increases drastically from 0.5% to 3.7%. While, with drugs involvement, it increases from 0.5% to 4.4%. The similar increase trends are also observed from serious injury and minor injury. In conclusion, alcohol and drugs involvement could contribute to the increase of accidents severity.
People-based analysis: Who are at risk? - Age
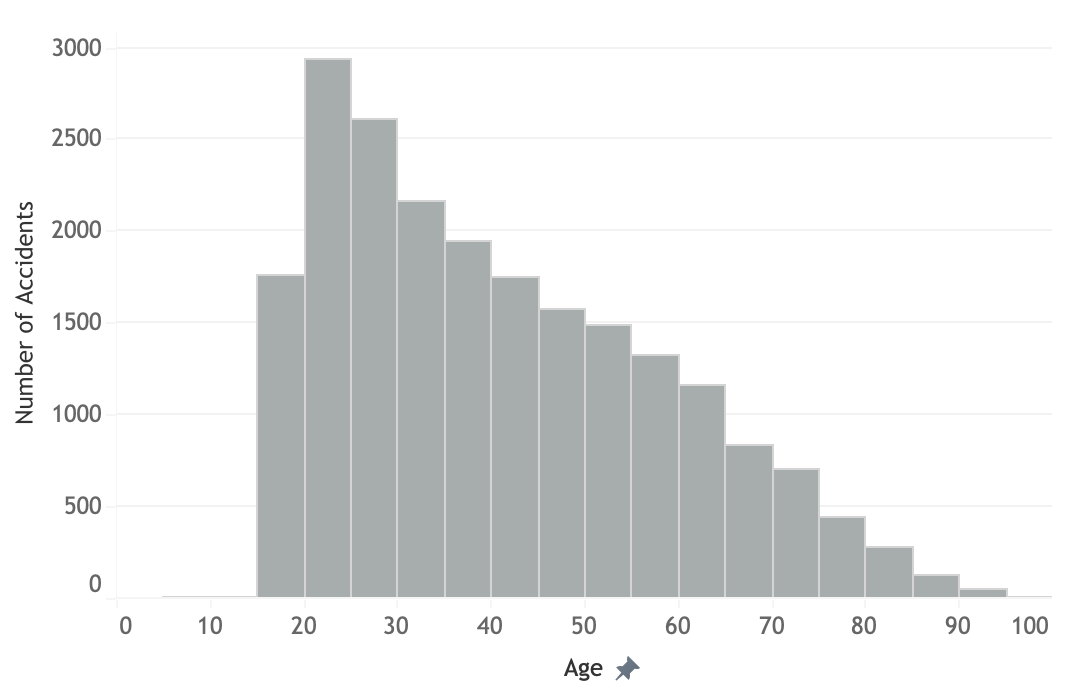 Accident distribution by age
 Percentage of number of accidents by age
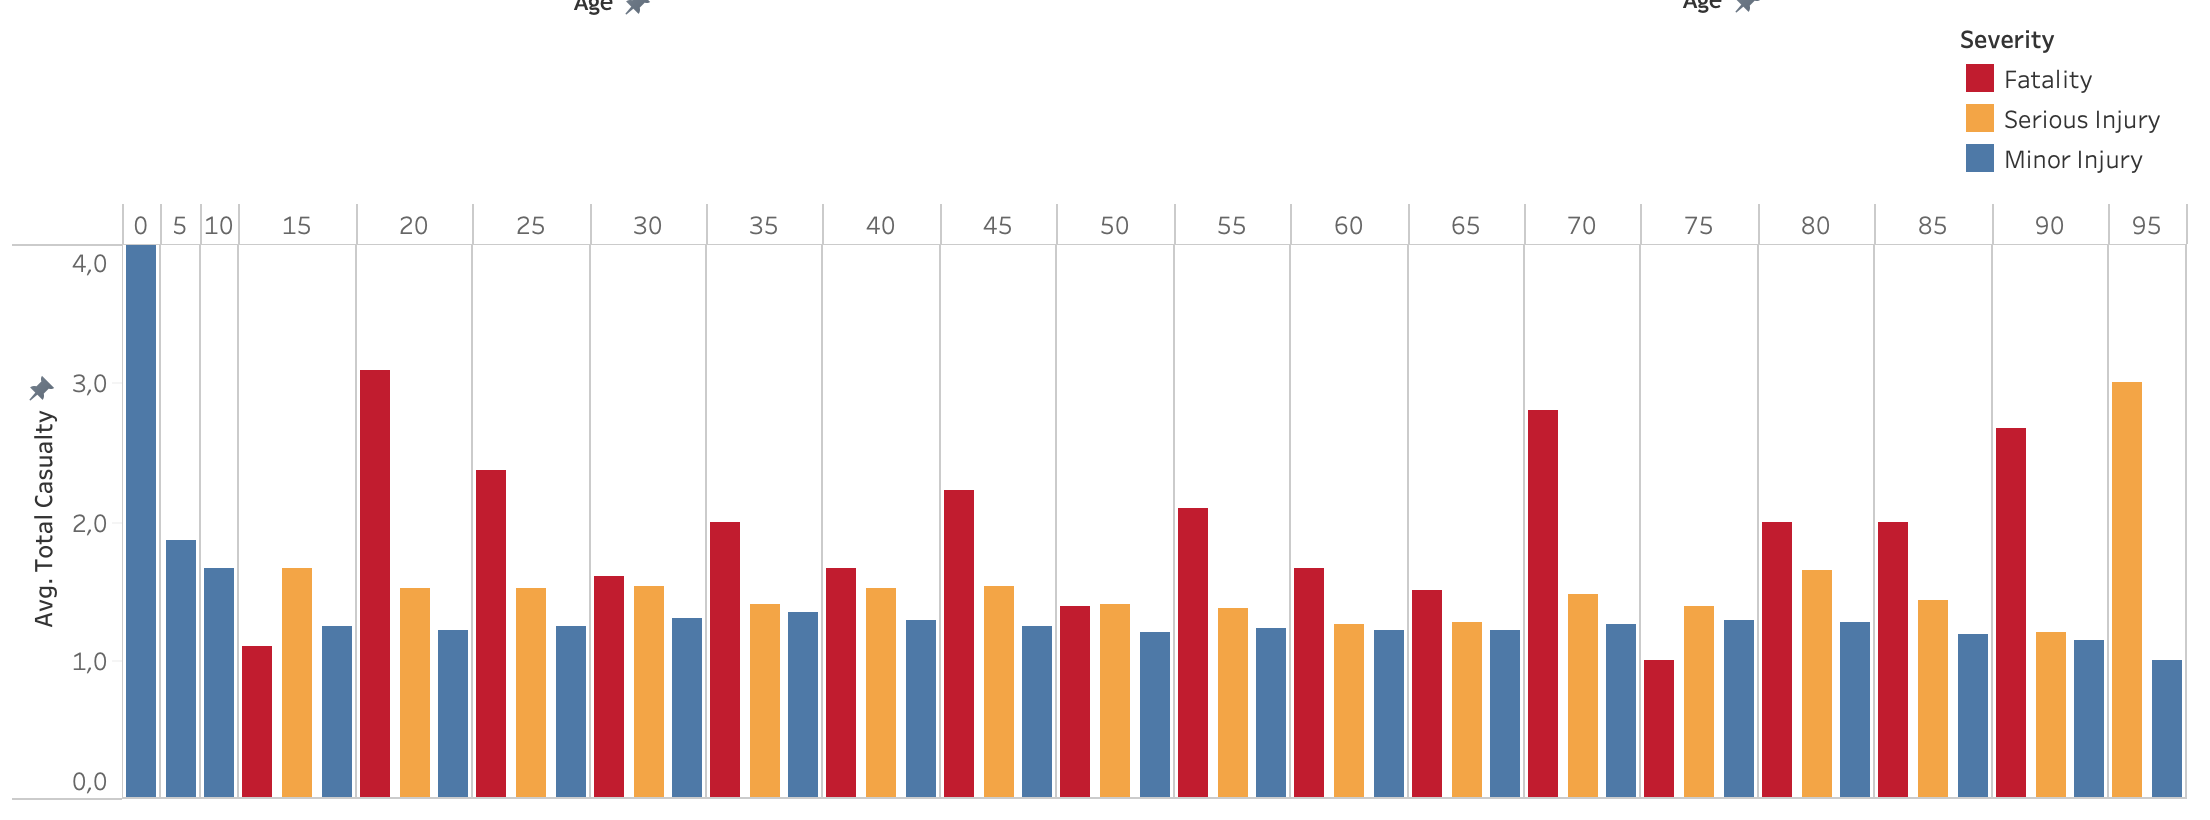 Average total casualty by age
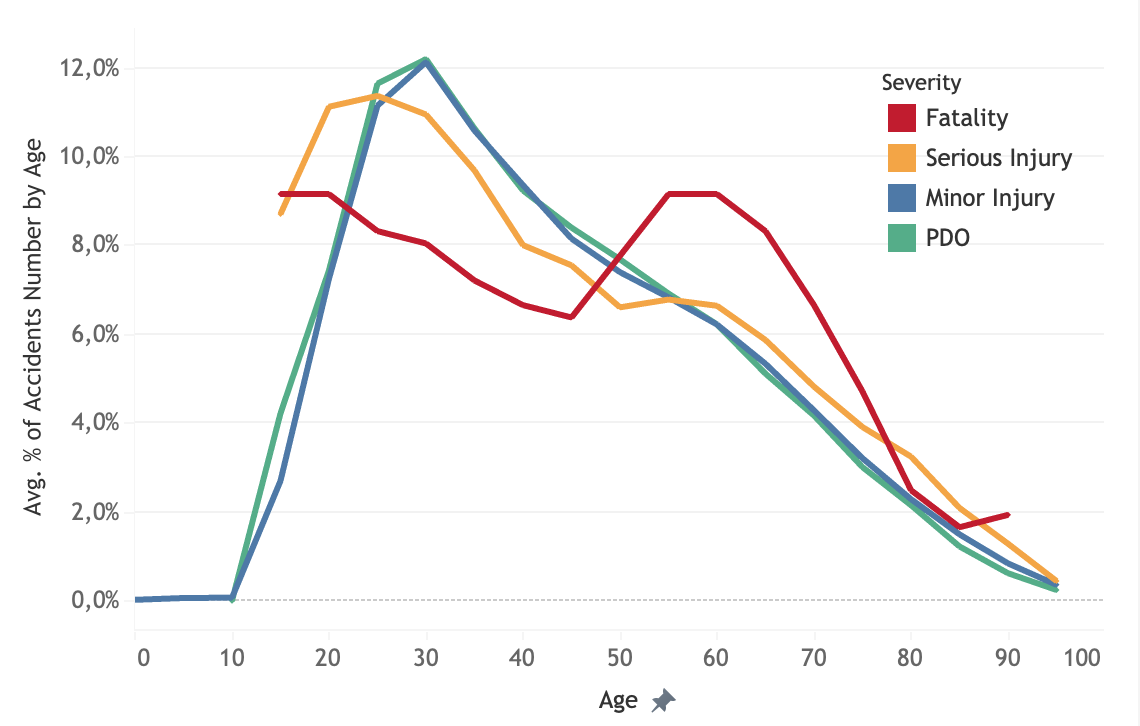
The highest number of accident happens with people 20-25 years of age. The number of accidents decreases linearly as a person gets older. This might be related to the awareness towards safety as people obtain maturity in driving experience. However, fatality cases are lower for younger people, below 45. The highest fatality happens at age of 55 to 60 years of age and decreases at older age. This might be related to less older people driving or generally being on the road. Interestingly, the victim of minor injury in average is quite high in baby and toddler (0-5 years old).
The highest casualty on fatality accidents in average still happen with people 20-25 years of age and it decreases slightly with increasing age. However, it generally raises again when people reach 70 years of age. In conclusion, children and very old people are the most vulnarable groups when it comes to injury and fatality, respectively.
Weather-based analysis - How does weather affect accident occurences?
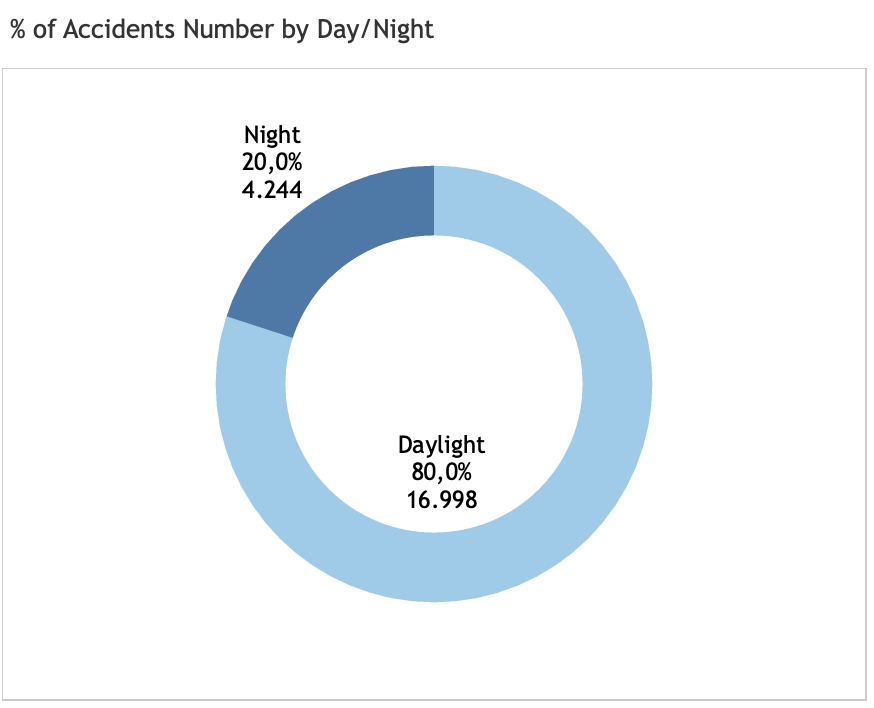 Day or Night?
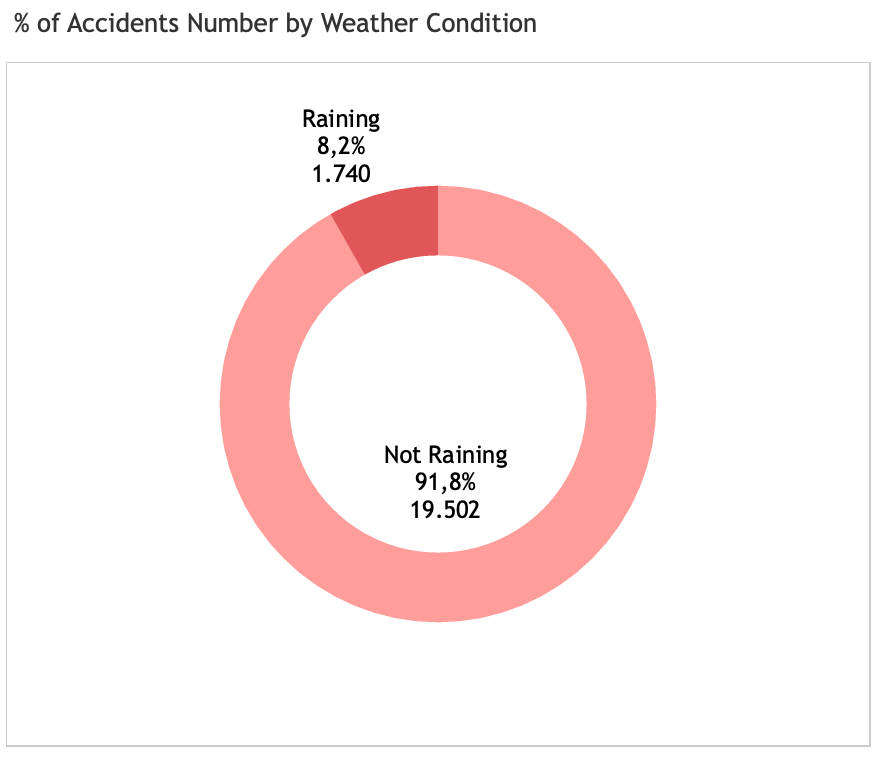 Weather condition: Raining or not raining?
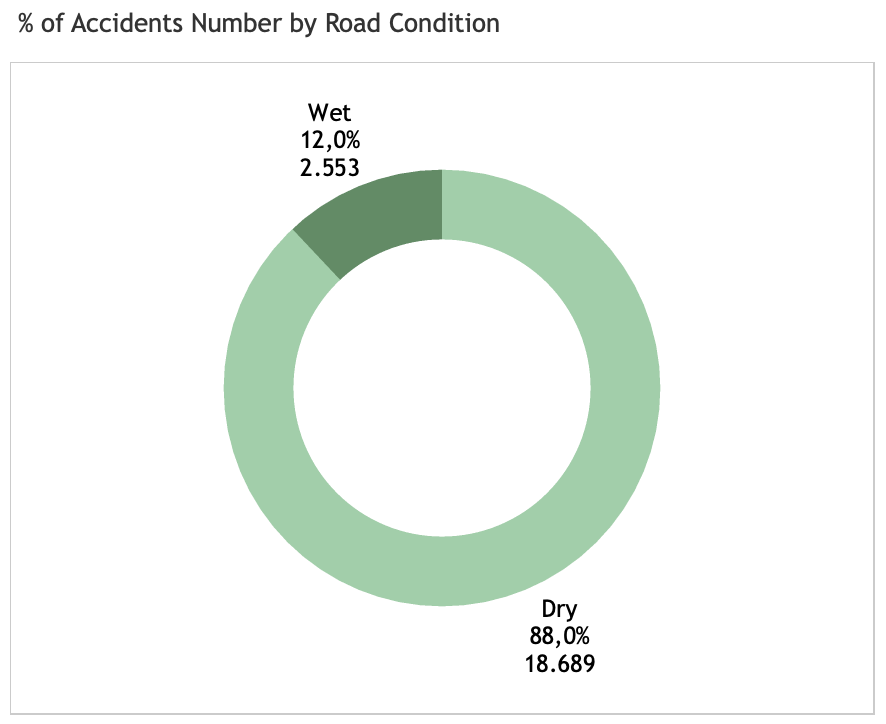 Road moisture: wet or dry?
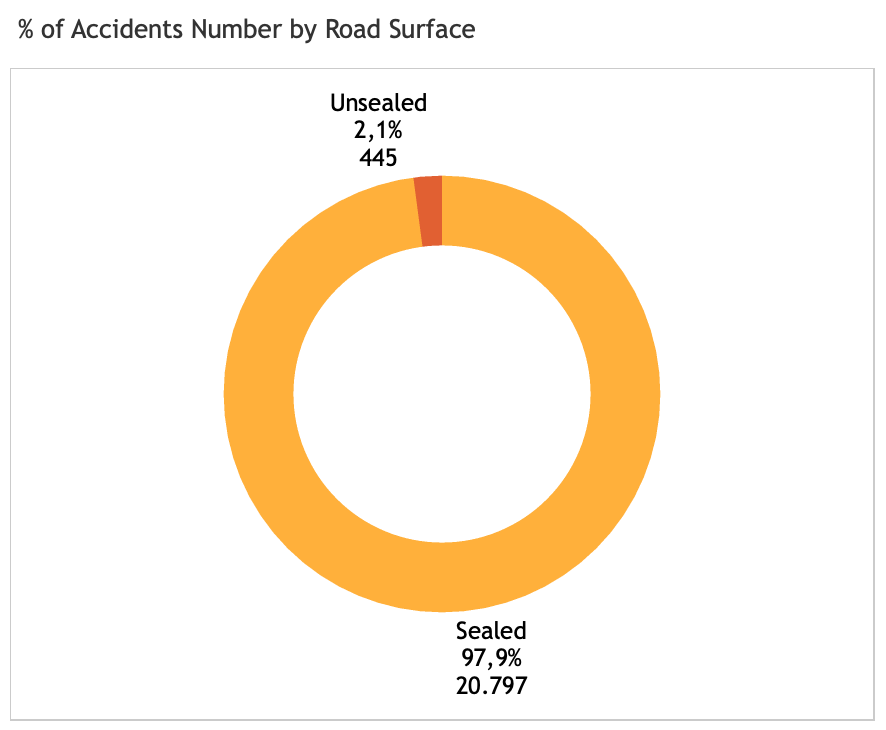 Road moisture: sealed or unsealed?
All those weather-related features are conditions collected at the crash locations. It is interesting that most accidents happen in the clear weather condtions, unlike what people normally assume. In other words, weather play little influence to accident events.
Spatial analysis - Is there any accident ‘hot-spot’?
 Crash map (circle marker map) - python
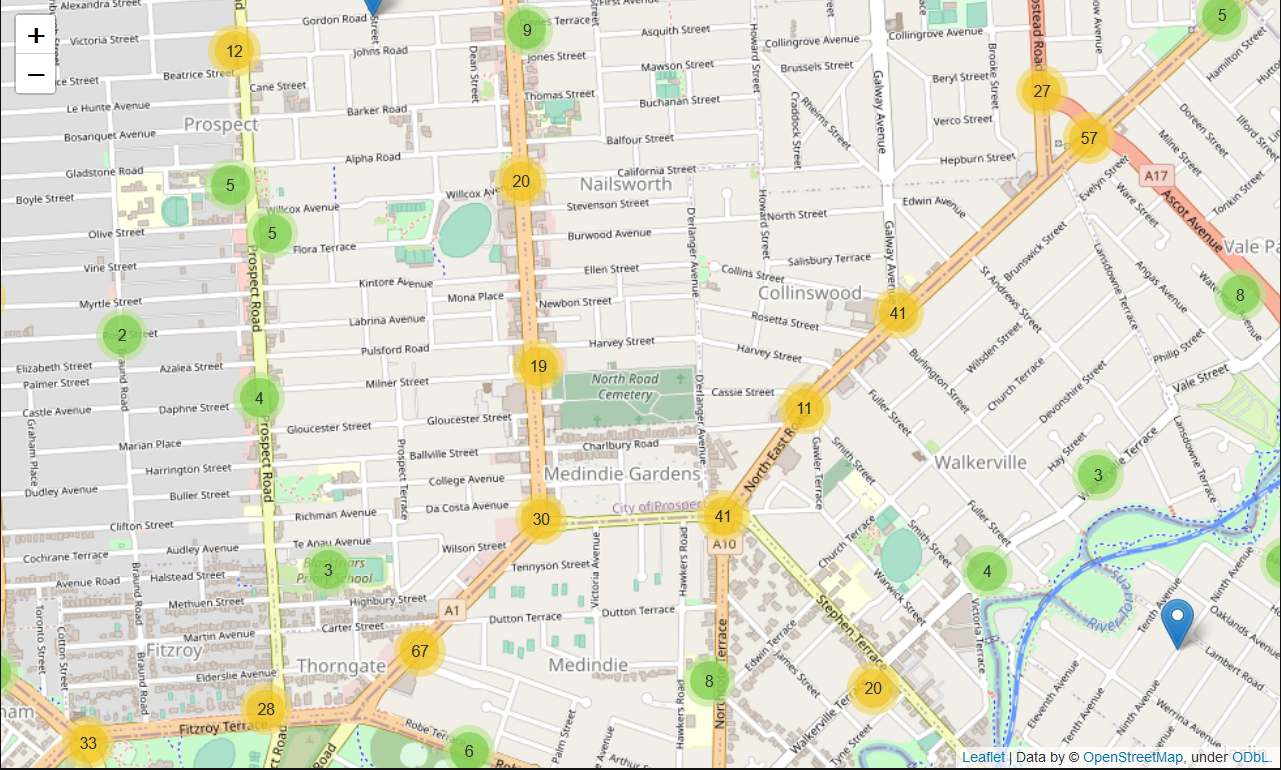
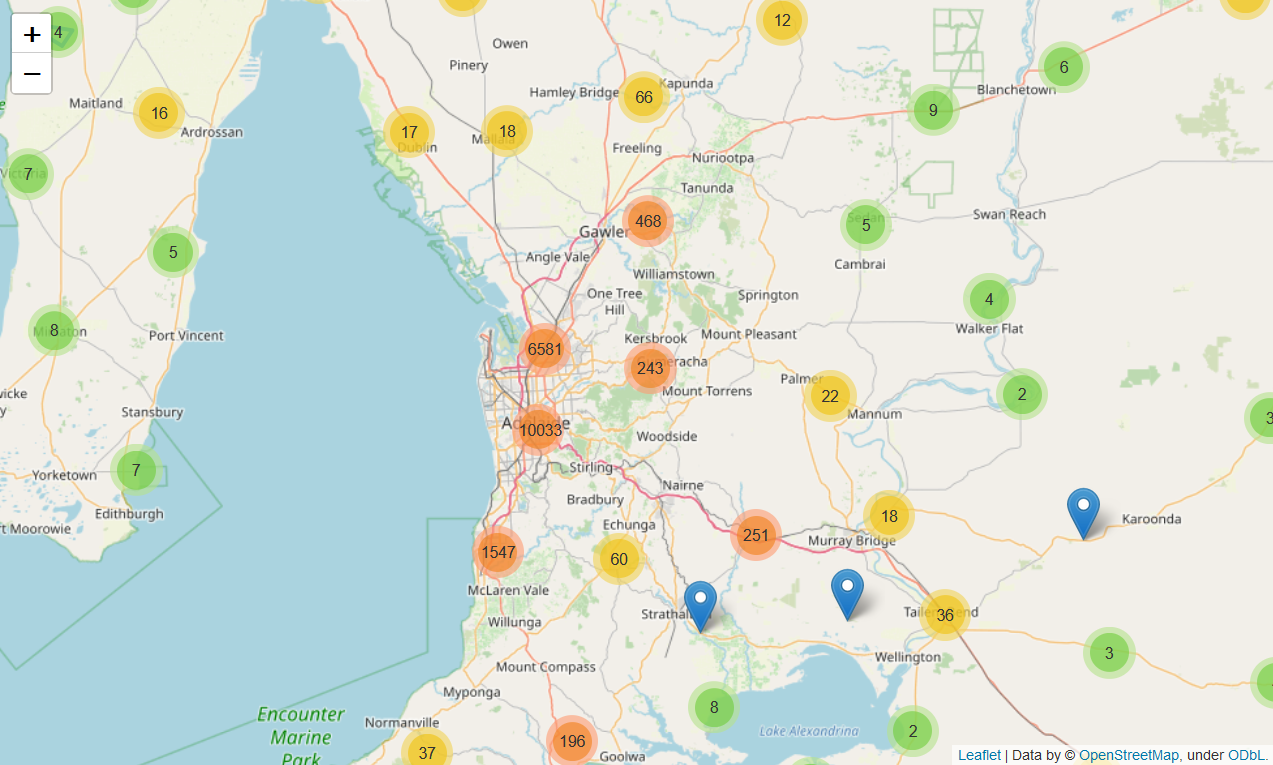 Crash map (cluster map) - python
 Crash map (cluster map - zoomed out) - python
There is indeed accident ‘hotspot’ where most accidents happen, which is clustered around Adelaide city center. From this point, a hypothesis could be then formulated: The more complicated the road system (meaning many junctions, divided roads, etc. which represents downtown area), the higher the number of accidents will be.
By plotting each accident spots based on its longitude and latitude using folium, it can be shown where accidents cluster and its number. The accident scenes can be zoomed out until street level to so see at what kind of road system the accident happens.
Below is map visualization I made in Tableau.
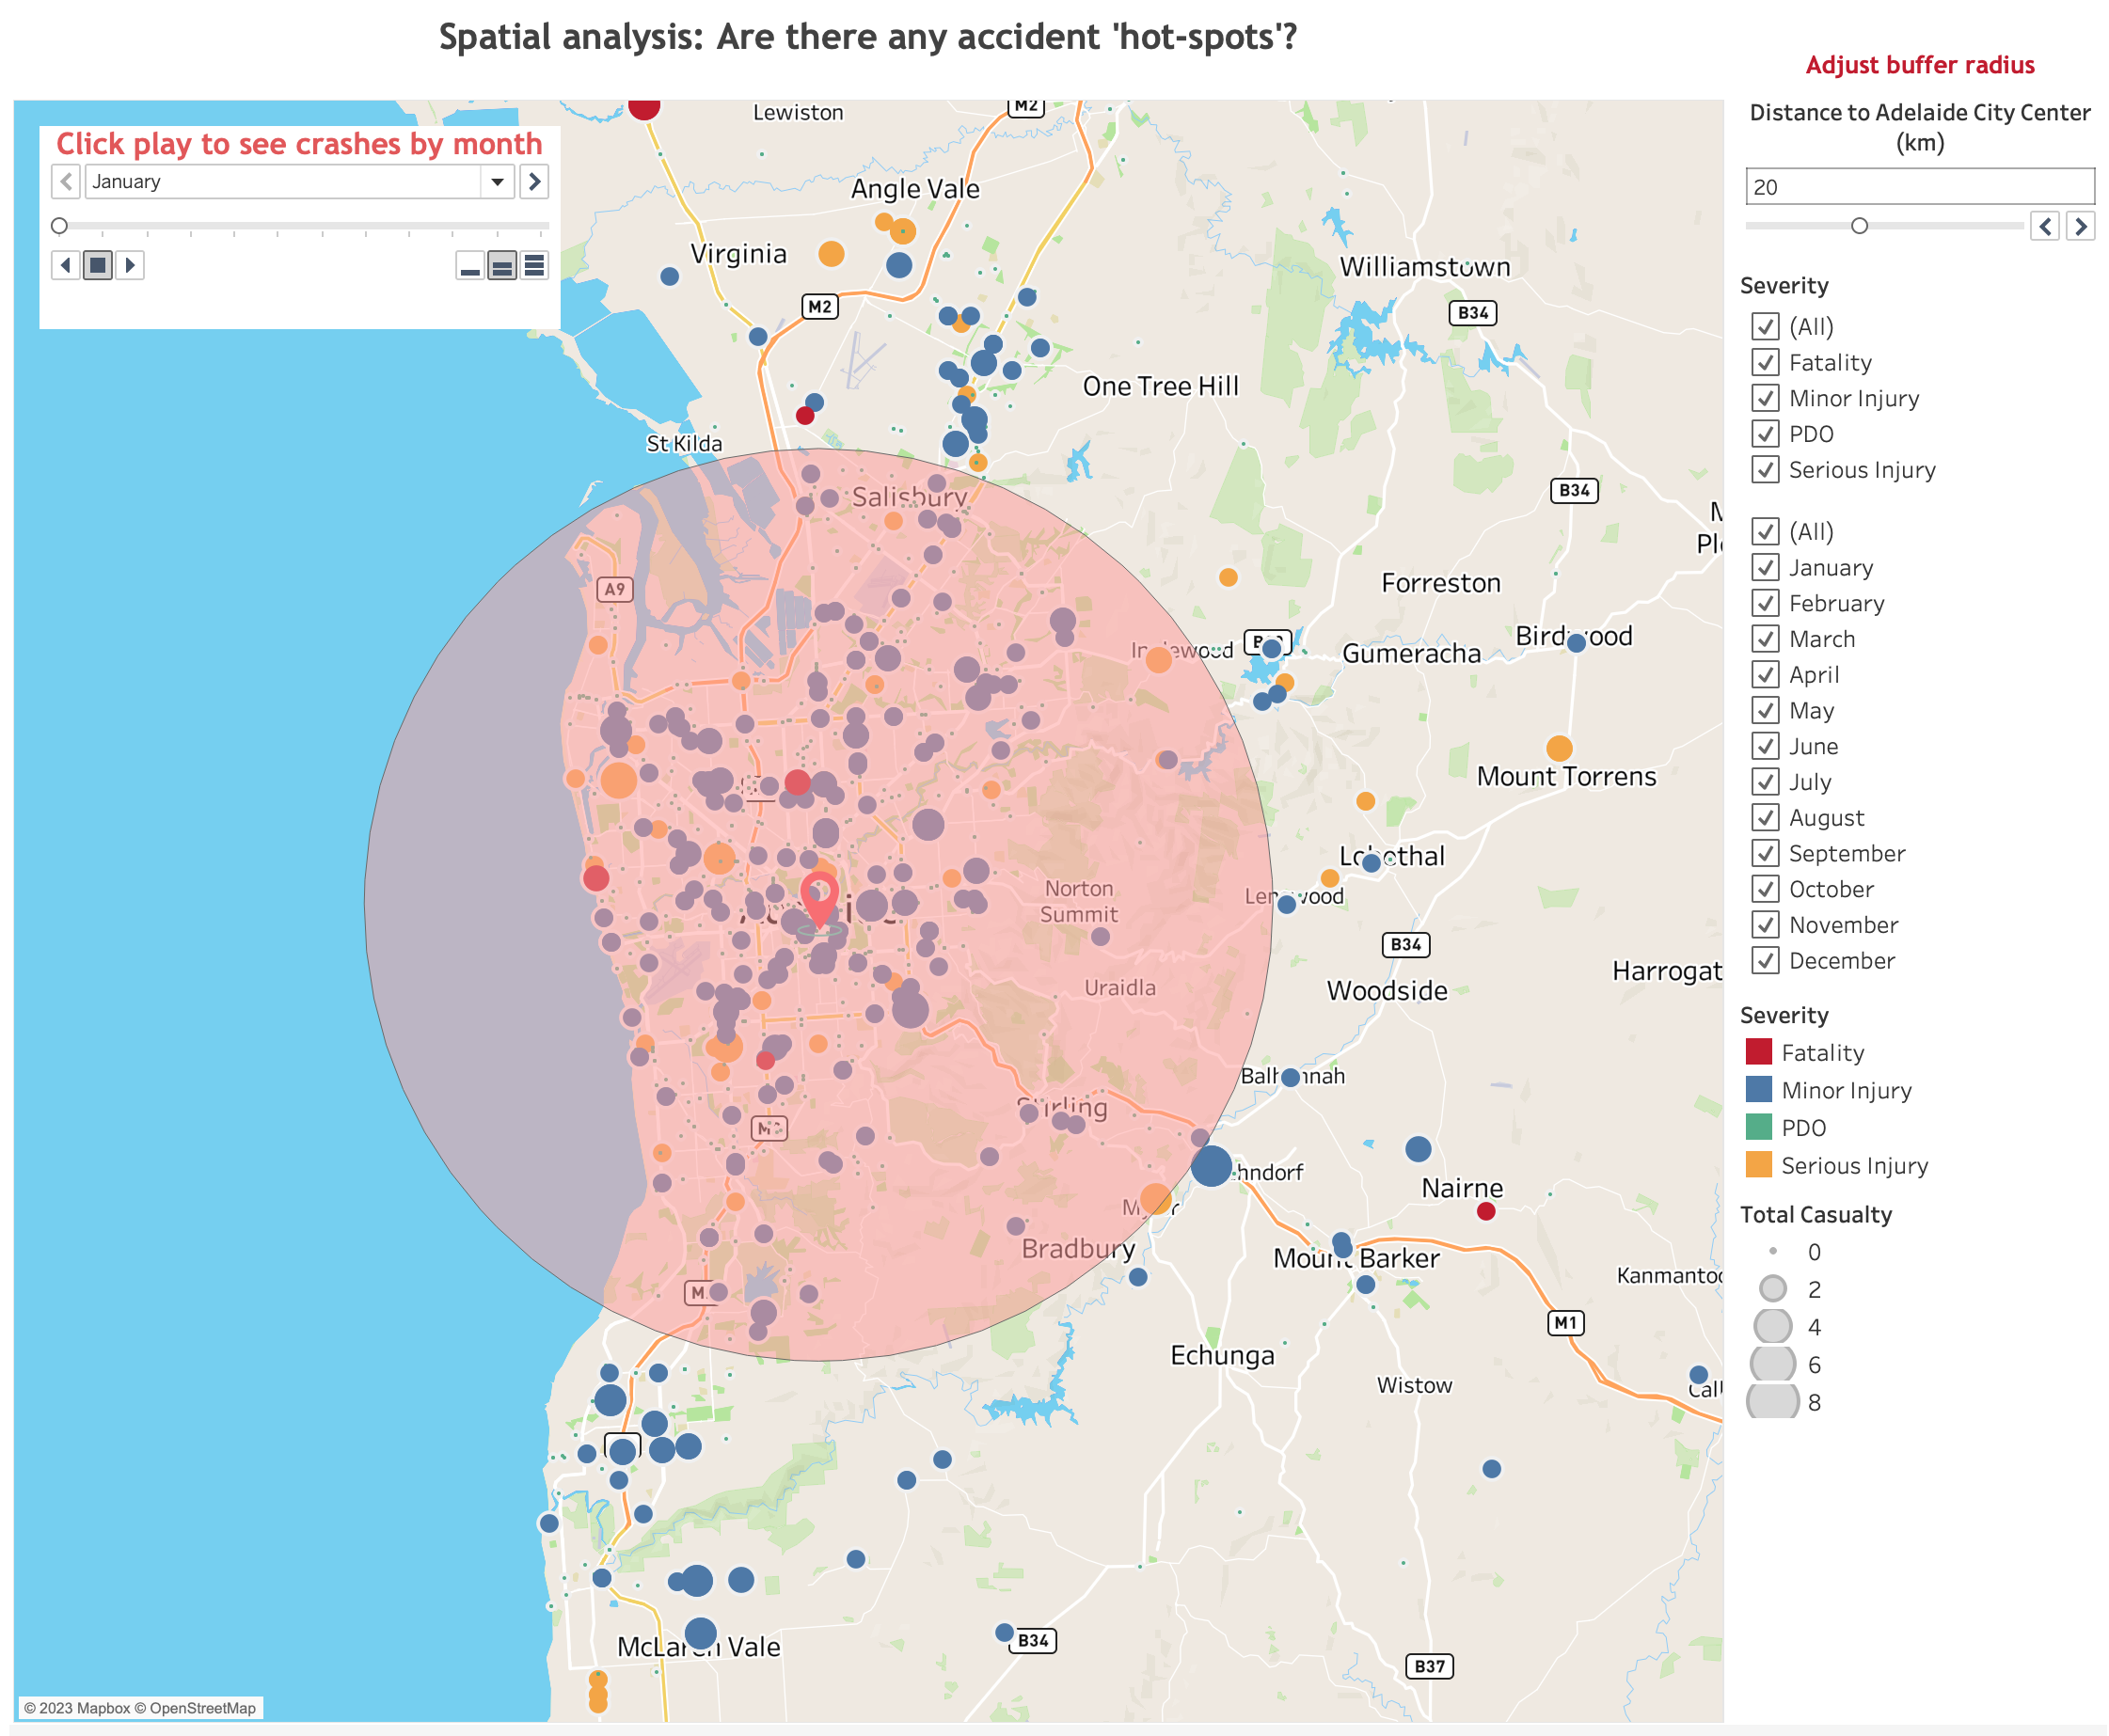 Crash map - tableau
Feature engineering for hypothesis testing - Distance to city center
Latitude and longitude of city center Adelaide city were used to calculate the distance from city center to the accident scene.
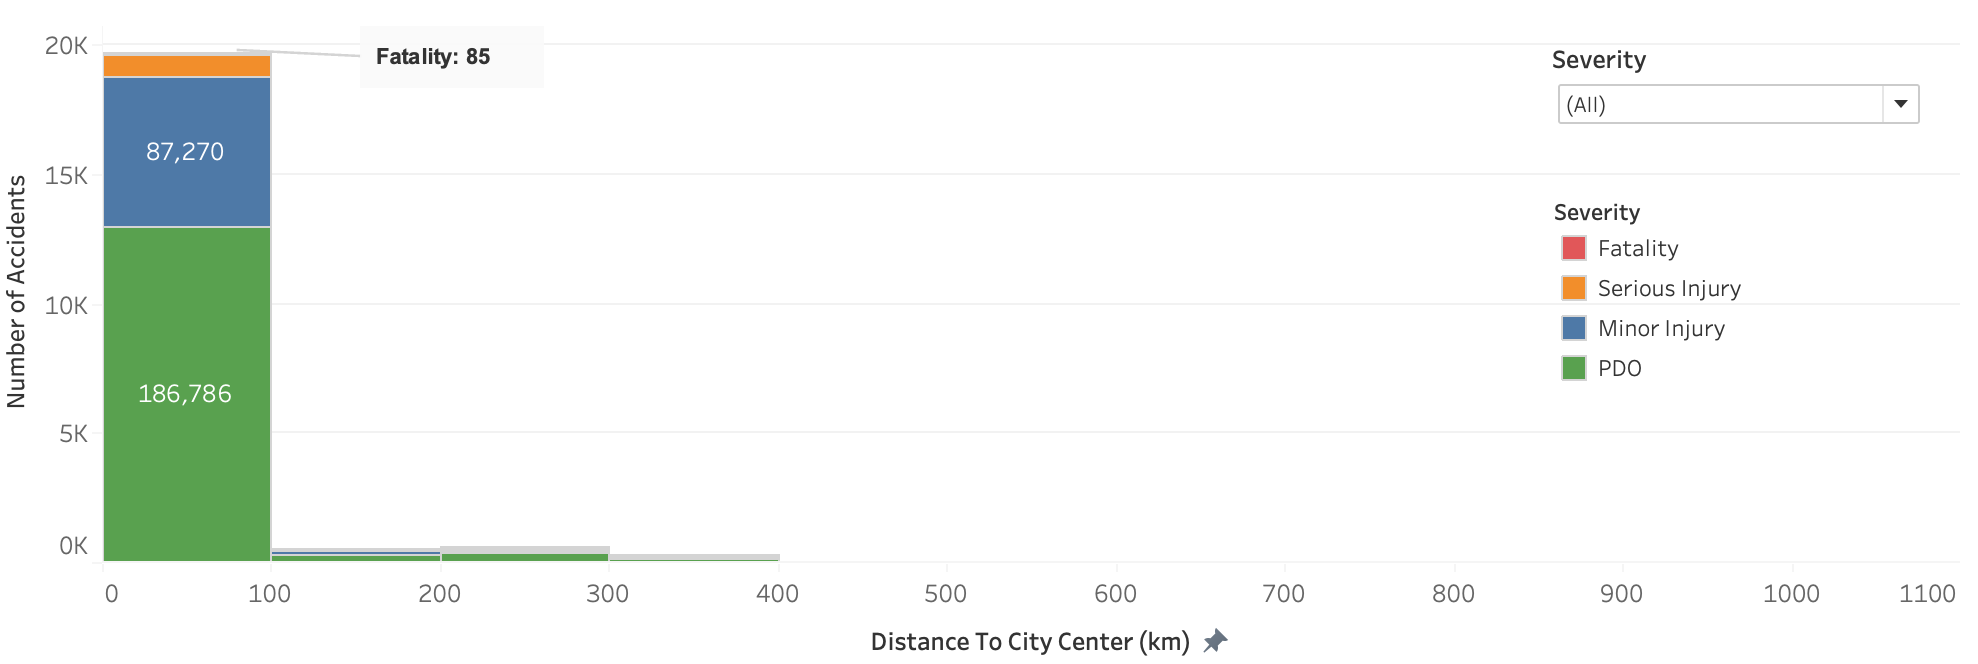 Number of accidents by the distance to Adelaide city center
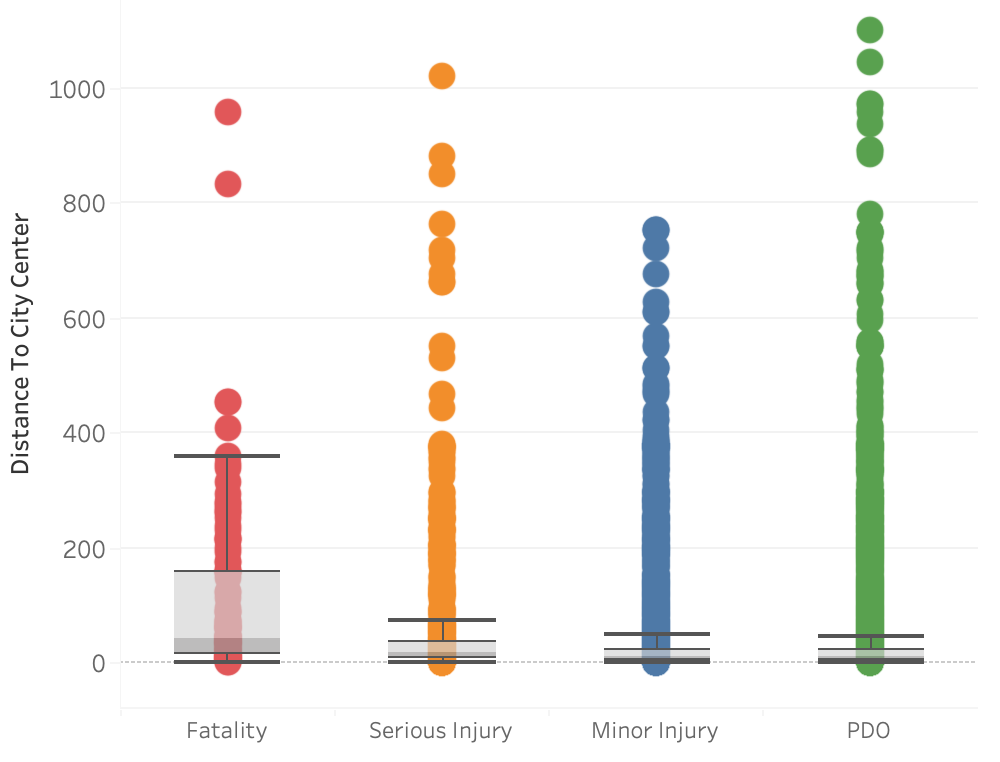 Crash distance distribution by severity
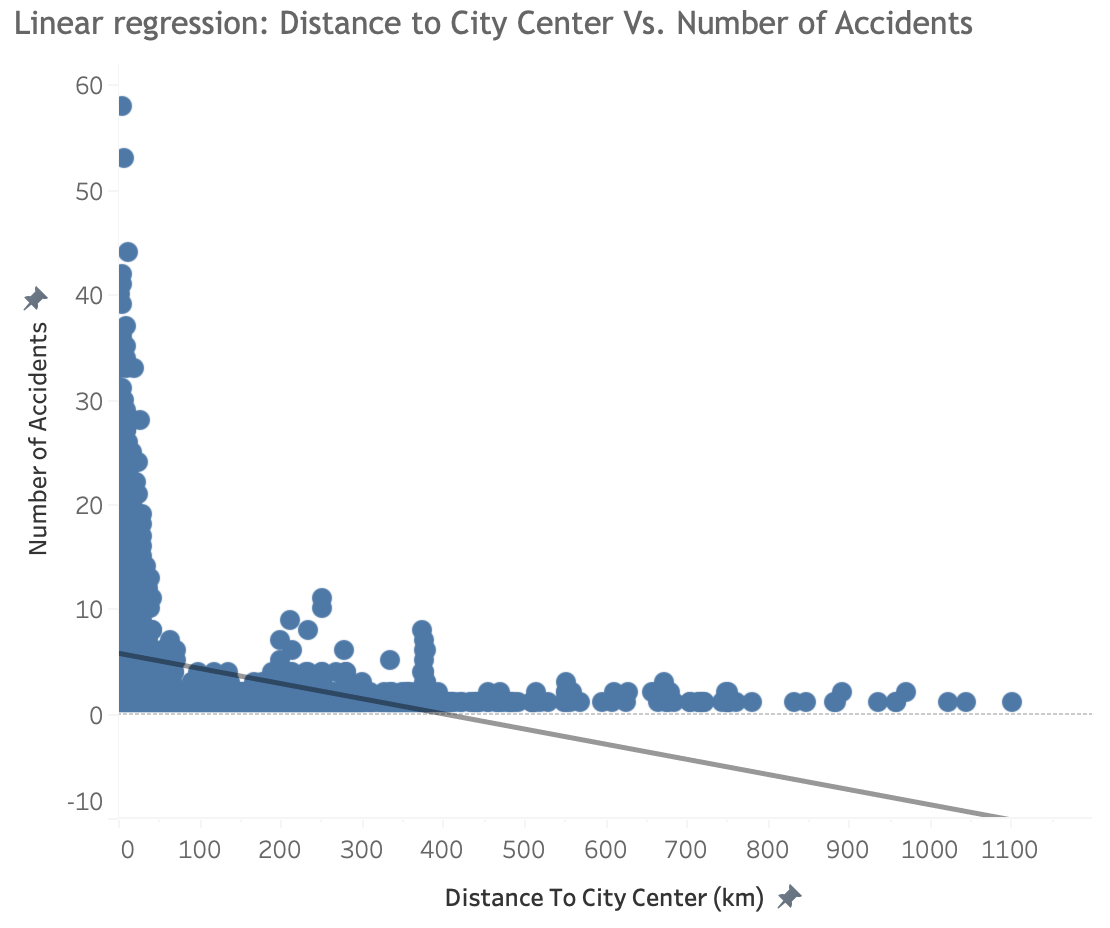 Linear regression: Distance to city center vs. Number of accidents
The hypothesis is only partially proved to be true. Most accidents cluster within 100 km from Adelaide city center. As the distance gets futher, less accident events occur. There is indeed negative correlation between distance to city center and number of accidents, however, their relationship is not linear. The linear regression model is not suitable for the data as it results in MSE: 30.5 and R2: 9.36%.
Interestingly, most fatalities incidents happened to be in close to the city center area. In other other words, not only does the complex road system corresponds postively to the number of accidents, but also to the accident severity.
Part 2: Data modeling - Supervised machine learning for predicting accident severity
All previously analyzed factors (time, age, sex, road system and distance to city center) seem to be influential to the accident severity. However, it is not clear to what extent those factors would impact severity. In other words, the order of importance is analyzed using classification model.
 Severity classes as target (dependent) variable
Bar chart above shows that we deal with highly imbalanced dataset that would deliver poor predictive performance, specifically for the minority class. This is a problem because typically, the minority class is more important and therefore the problem is more sensitive to classification errors for the minority class than the majority class.
There are of course techniques to handle the imbalance dataset problem in classification. I would link good articles for that here and here. However, for the sake of simplicity, binary classification was choosen consiting of injury/death group (sum of fatality, serious and minor injury) and PDO.
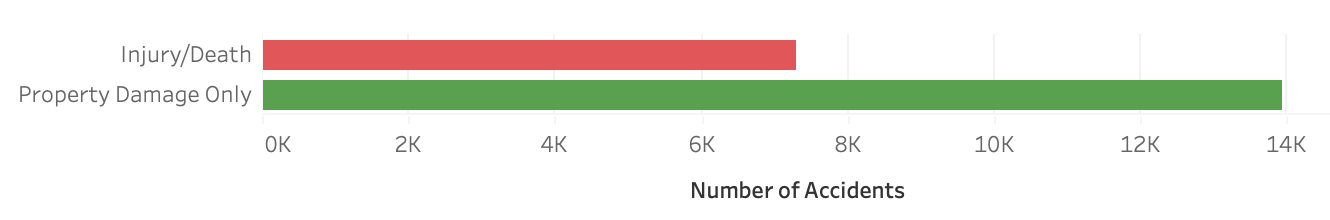 Severity classes as target (dependent) variable - Binary classification
Classification models of logistic regression, decision tree and random forest were used and the results were compared. The best result was given by random forest classifier, giving accuracy of 74.3%. While logistic regression gives 66.8% and decision tree 61.8%.
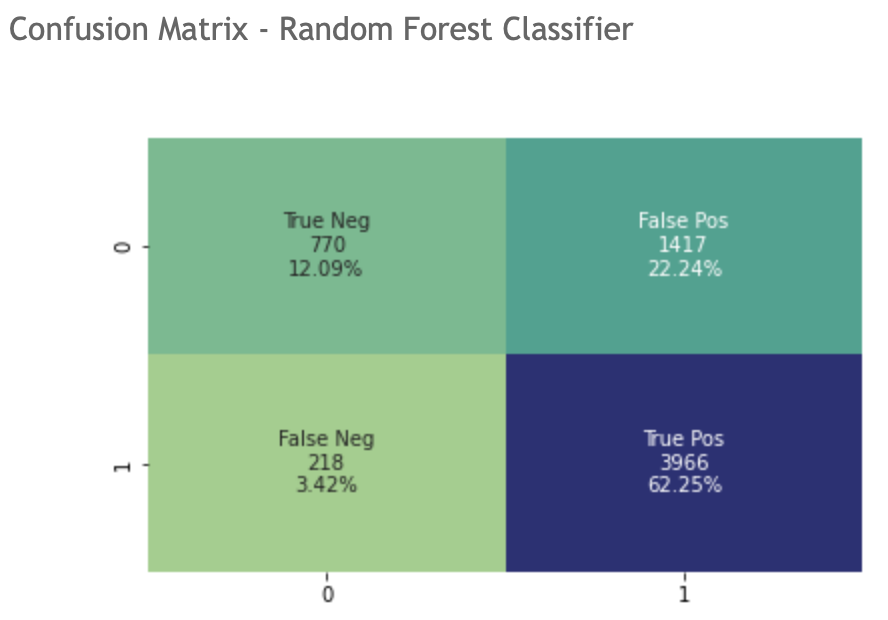 Confusion matrix - Random forest
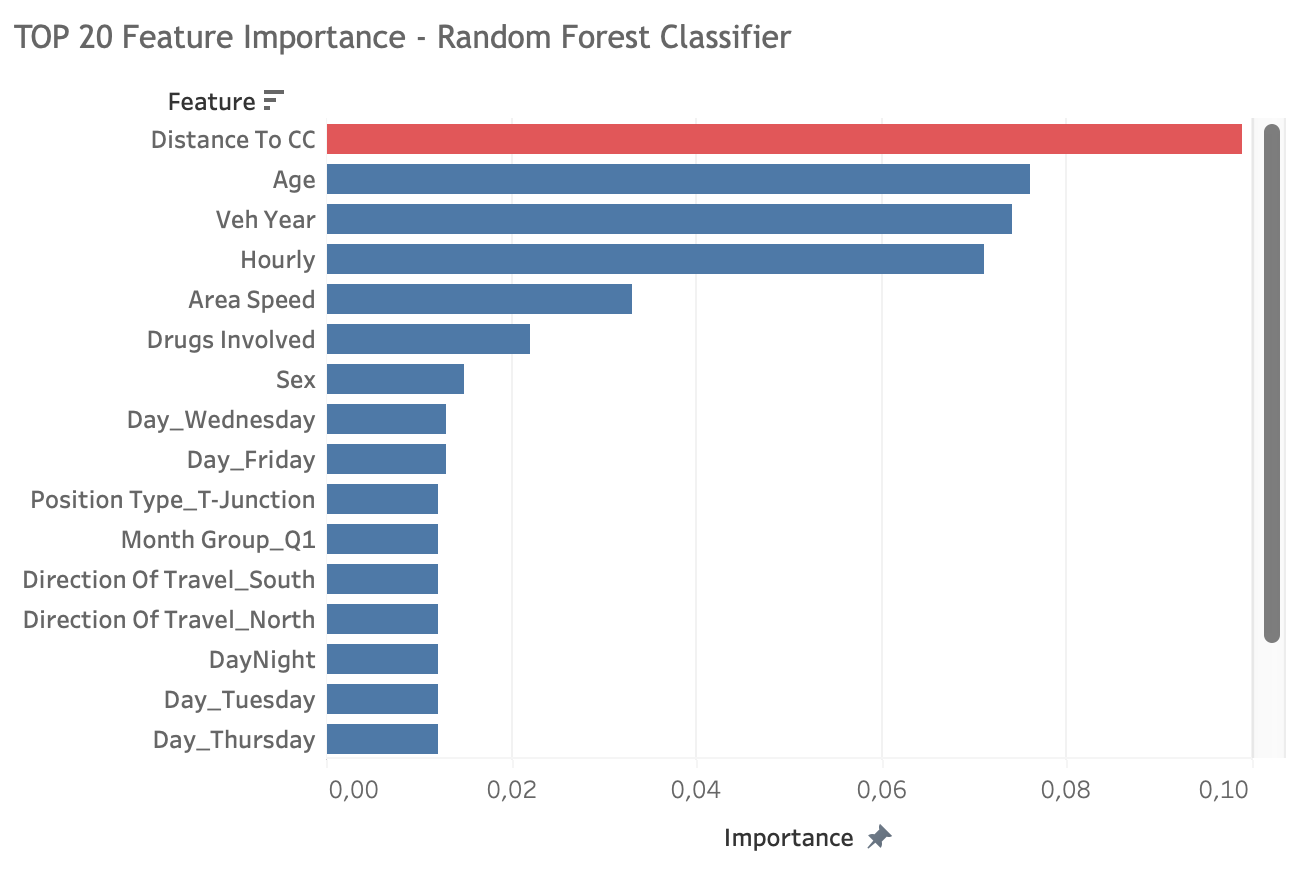 Feature importance - Random forest
Among top 20 important fetaures, distance to city center become to be the most influential factor, followed by age, vehicle year, time, location or area, drugs usage and sex. Other than that, crash location at T-Junction listed as an important factor strengthens the previous hyphothesis about complex road system.
Limitations
- The severity is indeed result of people not using safety equipment, such as helmet or safey belt. Dataset has this feature in it, however, it could not be used for this analysis as 90% of the data is missing.
- Accidents occur at a very remote areas of South Australia might be not recorded or captured as many as accidents that occur in developed areas.
- Based on the analysis results, it can be inferred that traffic volume play a role in the traffic accidents. However, this traffic volume feature at the time the accident occurs was not present in the dataset.
- The imbalance dataset limits the prediction only to binary classification.
Further Analysis
The effect of safety equipment used by the victims or people involved on the traffic accidents should be analyzed and included in the model.
Final Notes
There are undeniably many factors that could cause or influence traffic accident occurrence, other than what was being analyzed in this analysis. However, providing insights from this data could certainly help involved parties such as local authority and community in taking measures preventing traffic accidents.
For instance:
- Designing less complex traffic system
- Conducting traffic control during rush-hour
- Taking into account of people's driving behavior when developing traffic system
- Raising people awareness when driving or being on the road, etc.
Finally, those insights could help creating safer environment and less financial loss due to property damage.
Find the code for this analysis Github
Find tableau presentation Tableau
Connect with me! Linkedin