![]() Source: upload.wikimedia.org
Source: upload.wikimedia.org
Overview - Business problem
Instacart is an online grocery store that has already made very good sales, but they want to uncover more information about their sales patterns. They assume they can’t target everyone using the same methods, and they’re considering a targeted marketing strategy. They want to target different customers with applicable marketing campaigns to see whether they have an effect on the sale of their products.
Goal
This analysis is intended to perform an initial exploratory data analysis in order to derive insights and suggest strategies for better segmentation based on the provided criteria. The key questions to be answered:
- What are the busiest days of the week and hours of the day are (i.e., the days and times with the most orders) in order to schedule ads at times when there are fewer orders?
- Are there are particular times of the day when people spend the most money, as this might inform the type of products they advertise at these times?
- As Instacart has a lot of products with different price tags, marketing and sales want to use simpler price range groupings to help direct their marketing efforts.
- Are there certain types of products that are more popular than others? The marketing and sales teams want to know which departments have the highest frequency of product orders.
- The marketing and sales teams are particularly interested in the different types of customers in their system and how their ordering behaviors differ.
- What’s the distribution among users in regards to their brand loyalty (i.e., how often do they return to Instacart)?
- Are there differences in ordering habits based on a customer’s loyalty status?
- Are there differences in ordering habits based on a customer’s region?
- Is there a connection between age and family status in terms of ordering habits?
- What different classifications does the demographic information suggest? Age? Income? Certain types of goods? Family status?
- What differences can you find in ordering habits of different customer profiles? Consider the price of orders, the frequency of orders, the products customers are ordering, or anything else.
Data
Instacart is a real company that’s made their data available online. However, the contents of the project brief as well as the data have been fabricated for the purpose of this project. The dataset comprises of information on the following parameters:
Data dictionary can be found here.
Process
This is python-based project to analyse and essentially to answer business questions of an online grocery store that operates through an app. First step is performing data wrangling which consist of data cleaning, consistency checking and merging. The merged dataset is used to answer above-defined business key question and the corresponding visualizations are performed using python.
Exploratory Data Analysis (EDA)
Busiest days of the week and hours of the day
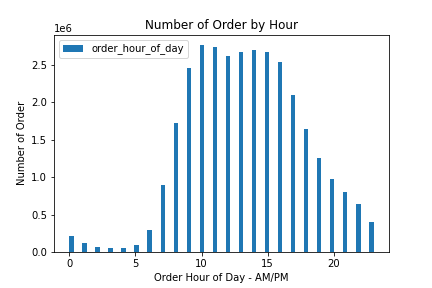
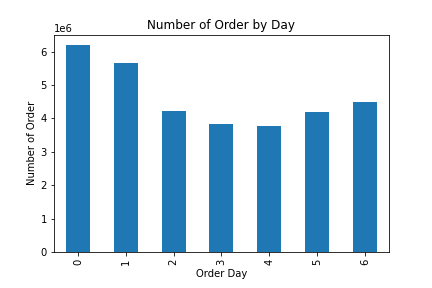
Those bar charts show that most orders occur between 10 AM to 3 PM with only slight differences. It starts to drop at 4 PM. However, afternoon and night orders are considerably high, compared to midnight orders (12-5 AM). Sunday (0) and Monday (1)are the most busiest days where most of orders are placed.
Recommendations:
- Ads should be intensified when orders are at minimum period, at 4 - 9 PM during weekdays.
- During weekend, ads could be targetted for new customers, such as referal bonus. When many people are ordering, they might also see this interesting offer and ask their families, friends, etc. to join.
Times of the day when people spend the most money
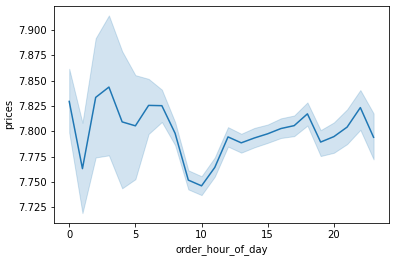
As depicted by the line chart above, customers tend to spend most of money on the midnight and morning orders, in this case, it is between 1 AM to 9 AM. However, from the previous histogram, it was discovered that this period of time is the low order period. In other words, this could mean that we earn more profit from these high value orders despite its low order quantity.
Interestingly, the lowest value of orders occured at 10 AM and slowly increase afterwards. While, the histogram clearly shown that day time is generaly busy time where most orders are placed. This also proves that we earn less profit from these low value orders despite its high order quantity.
Recommendations: Ads of high range products should be started at 10 AM until around 6 PM.
Price range groupings to direct marketing efforts
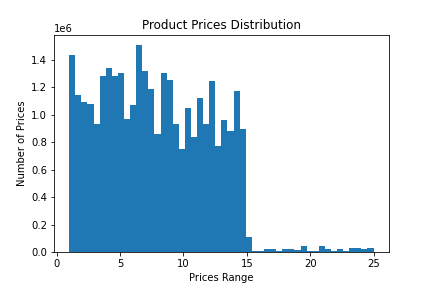
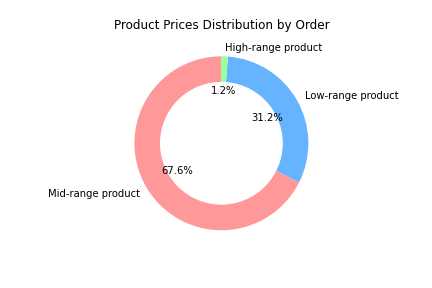
- If a product costs less than or equal to $5, it will be labeled ‘Low-range product’.
- If a product costs more than $5 but less than $15, it will be labeled ‘Mid-range product’.
- If a product costs more than or equal to $15, it will be labeled ‘High-range product’.
The histogram above shows the range of product prices. The lowest, highest and average price are $1, $25 and $7.4, respectively. The majority of instacart products is concentrated in the low to mid-range group and only 1.3% of all products is high-range product. From the order pie chart (second pie chart), it can be seen that the products availability for each group corresponds to the number of order.
Recommendations:
In general, the order of high-range products is considered low compared to the mid and low-range products. Altough it may seem too tempting to sell more high-range products in order to gain high profit by just one order, however, it can be challenging as the price is also higher as:
- first, customer may think several times before buying and compare to other stores as they have to spend quite amount of money. This of course could influence the number of order.
- second, based on the first point, sales and marketing team should learn how the competition situation in the high-range products.
- third, high-range products means greater loss when they aren't handled properly, for example during delivery by supplier or during storing.
Deeper research should be performed to address those three points. Afterwards, ads can then be adjusted accordingly.
Popular products and departments
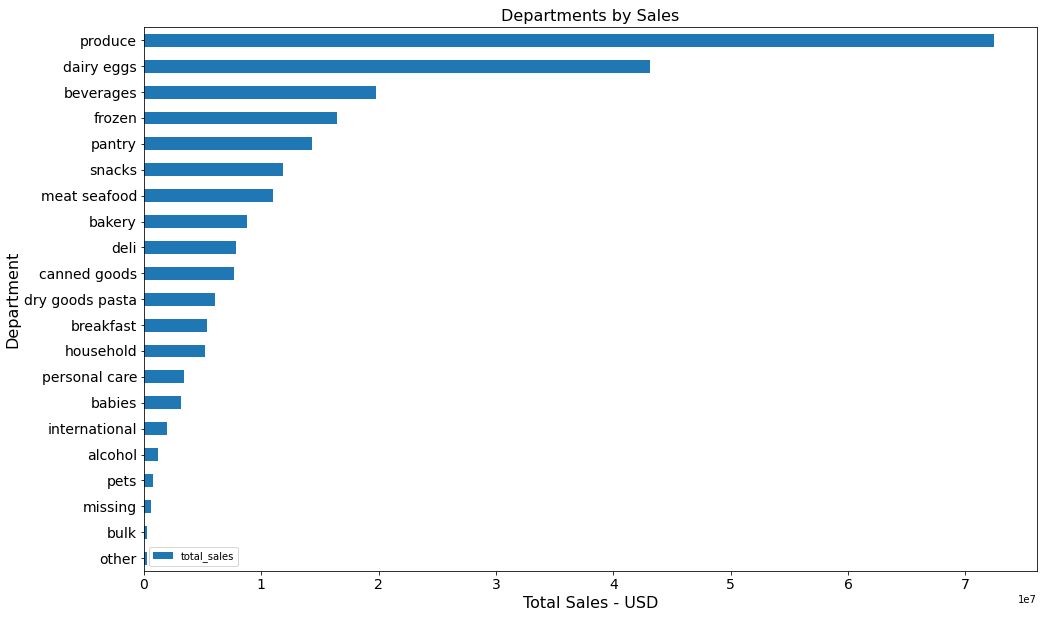
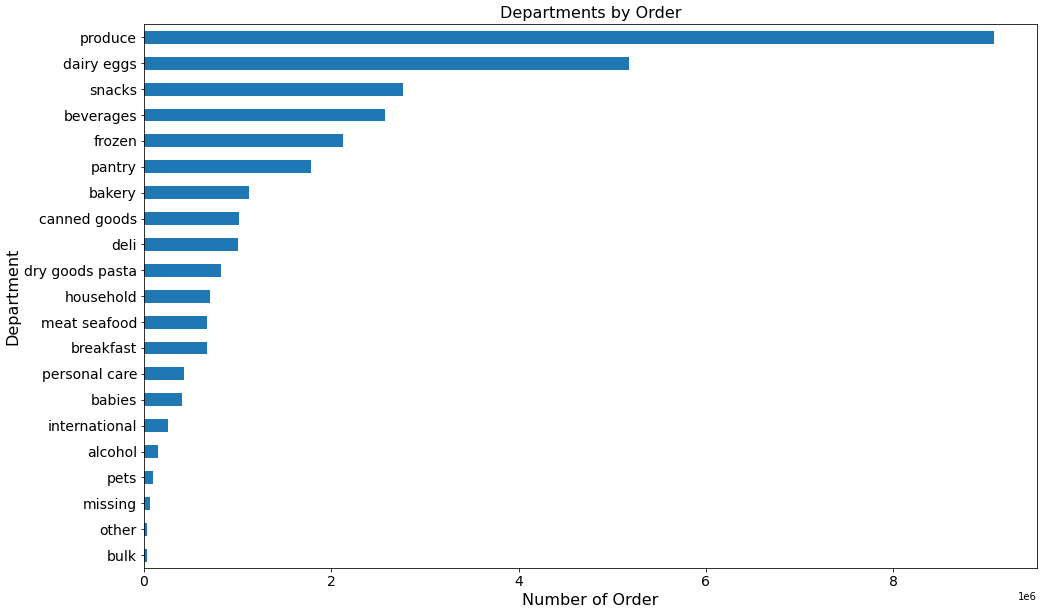
Looking at two bar charts above, 4 most profitable departments are: dairy eggs, produce, beverages and snacks. It is therefore interesting to see which kind of customers places those orders. For reference: Produce is a generalized term for many farm-produced crops, including fruits and vegetables (grains, oats, etc. are also sometimes considered produce). More specifically, the term produce often implies that the products are fresh and generally in the same state as where and when they were harvested.
Recommendations:
- Ads should be made more actively on these 4 departments, for example by regularly informing what products are currently on the discount and what will be discounted in the next turn.
- For products from produce department, it should be highlighted in case those products are locally produced. This of course could influence customers who are aware of sustainability issue.
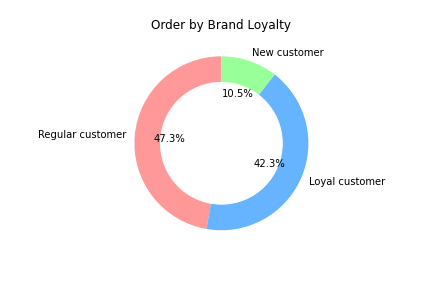
Customer types and behavior - Brand loyalty
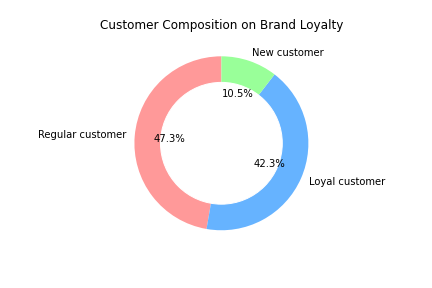
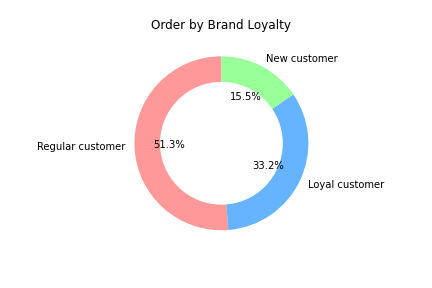
- If a customer makes less than or equal to 10 orders, it will be labeled ‘New customer’.
- If a customer makes more than 10 orders but less than 40 orders, it will be labeled ‘Regular customer’.
- If a customer makes more than 40 orders, it will be labeled ‘Loyal customer’.
It can be seen that regular customers and loyal customers made up the majority of Instacart current customer. As regular and loyal customers are the majority, most orders are made by these two groups.
Recommendations:
More research should be conducted on these groups, for example questionnaire on: why someone decides to join as a new customer, what makes them loyal and what encourage them to regularly shop on Instacart?
Once their motives are discovered, specific ads should be effectively targeted to each of this group.
Customer types and behavior - Ordering habits by loyalty status
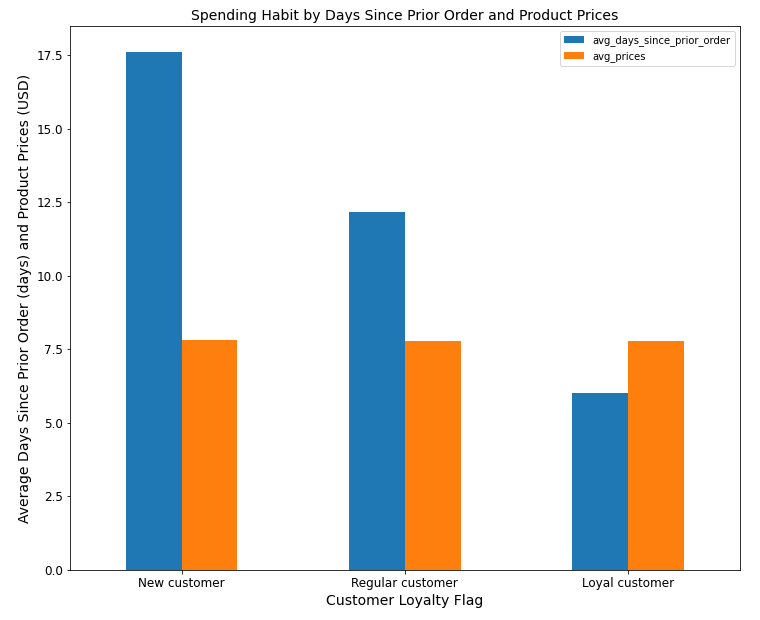
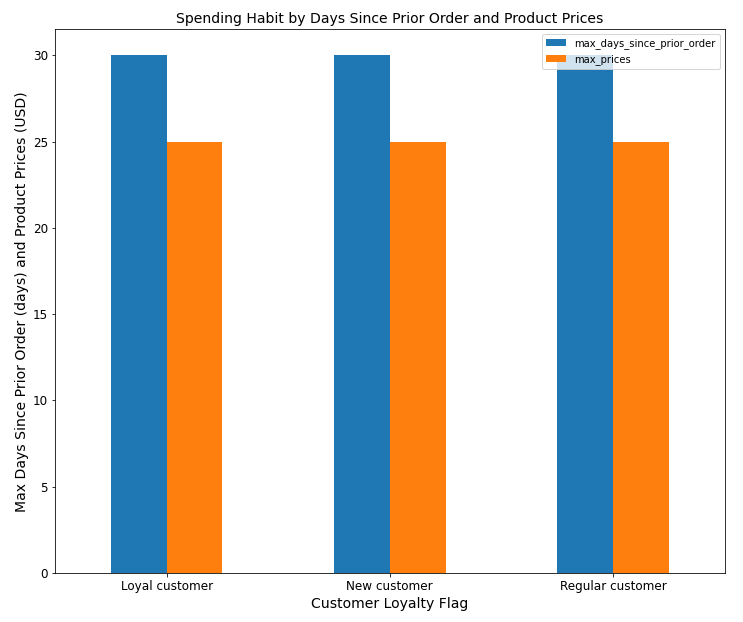
The bar charts above shows the spending habit in average and in maximum values in terms of day since prior order and products prices. Generally, their habit in spending is not quite different from each other. The only difference is that loyal customer in average made the fastest order since the previous order, followed by regular and new customers.
Recommendations:
Regular reminder (for example: notification via app, email, etc.) could be used to encourage new customers to make new orders.
Customer types and behavior - Ordering habits by region
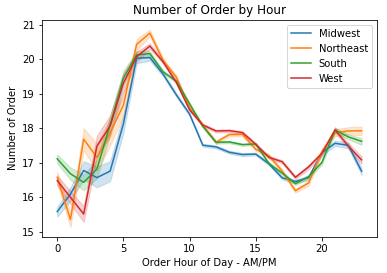
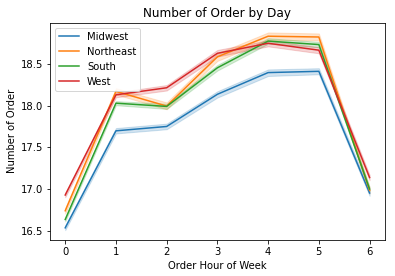
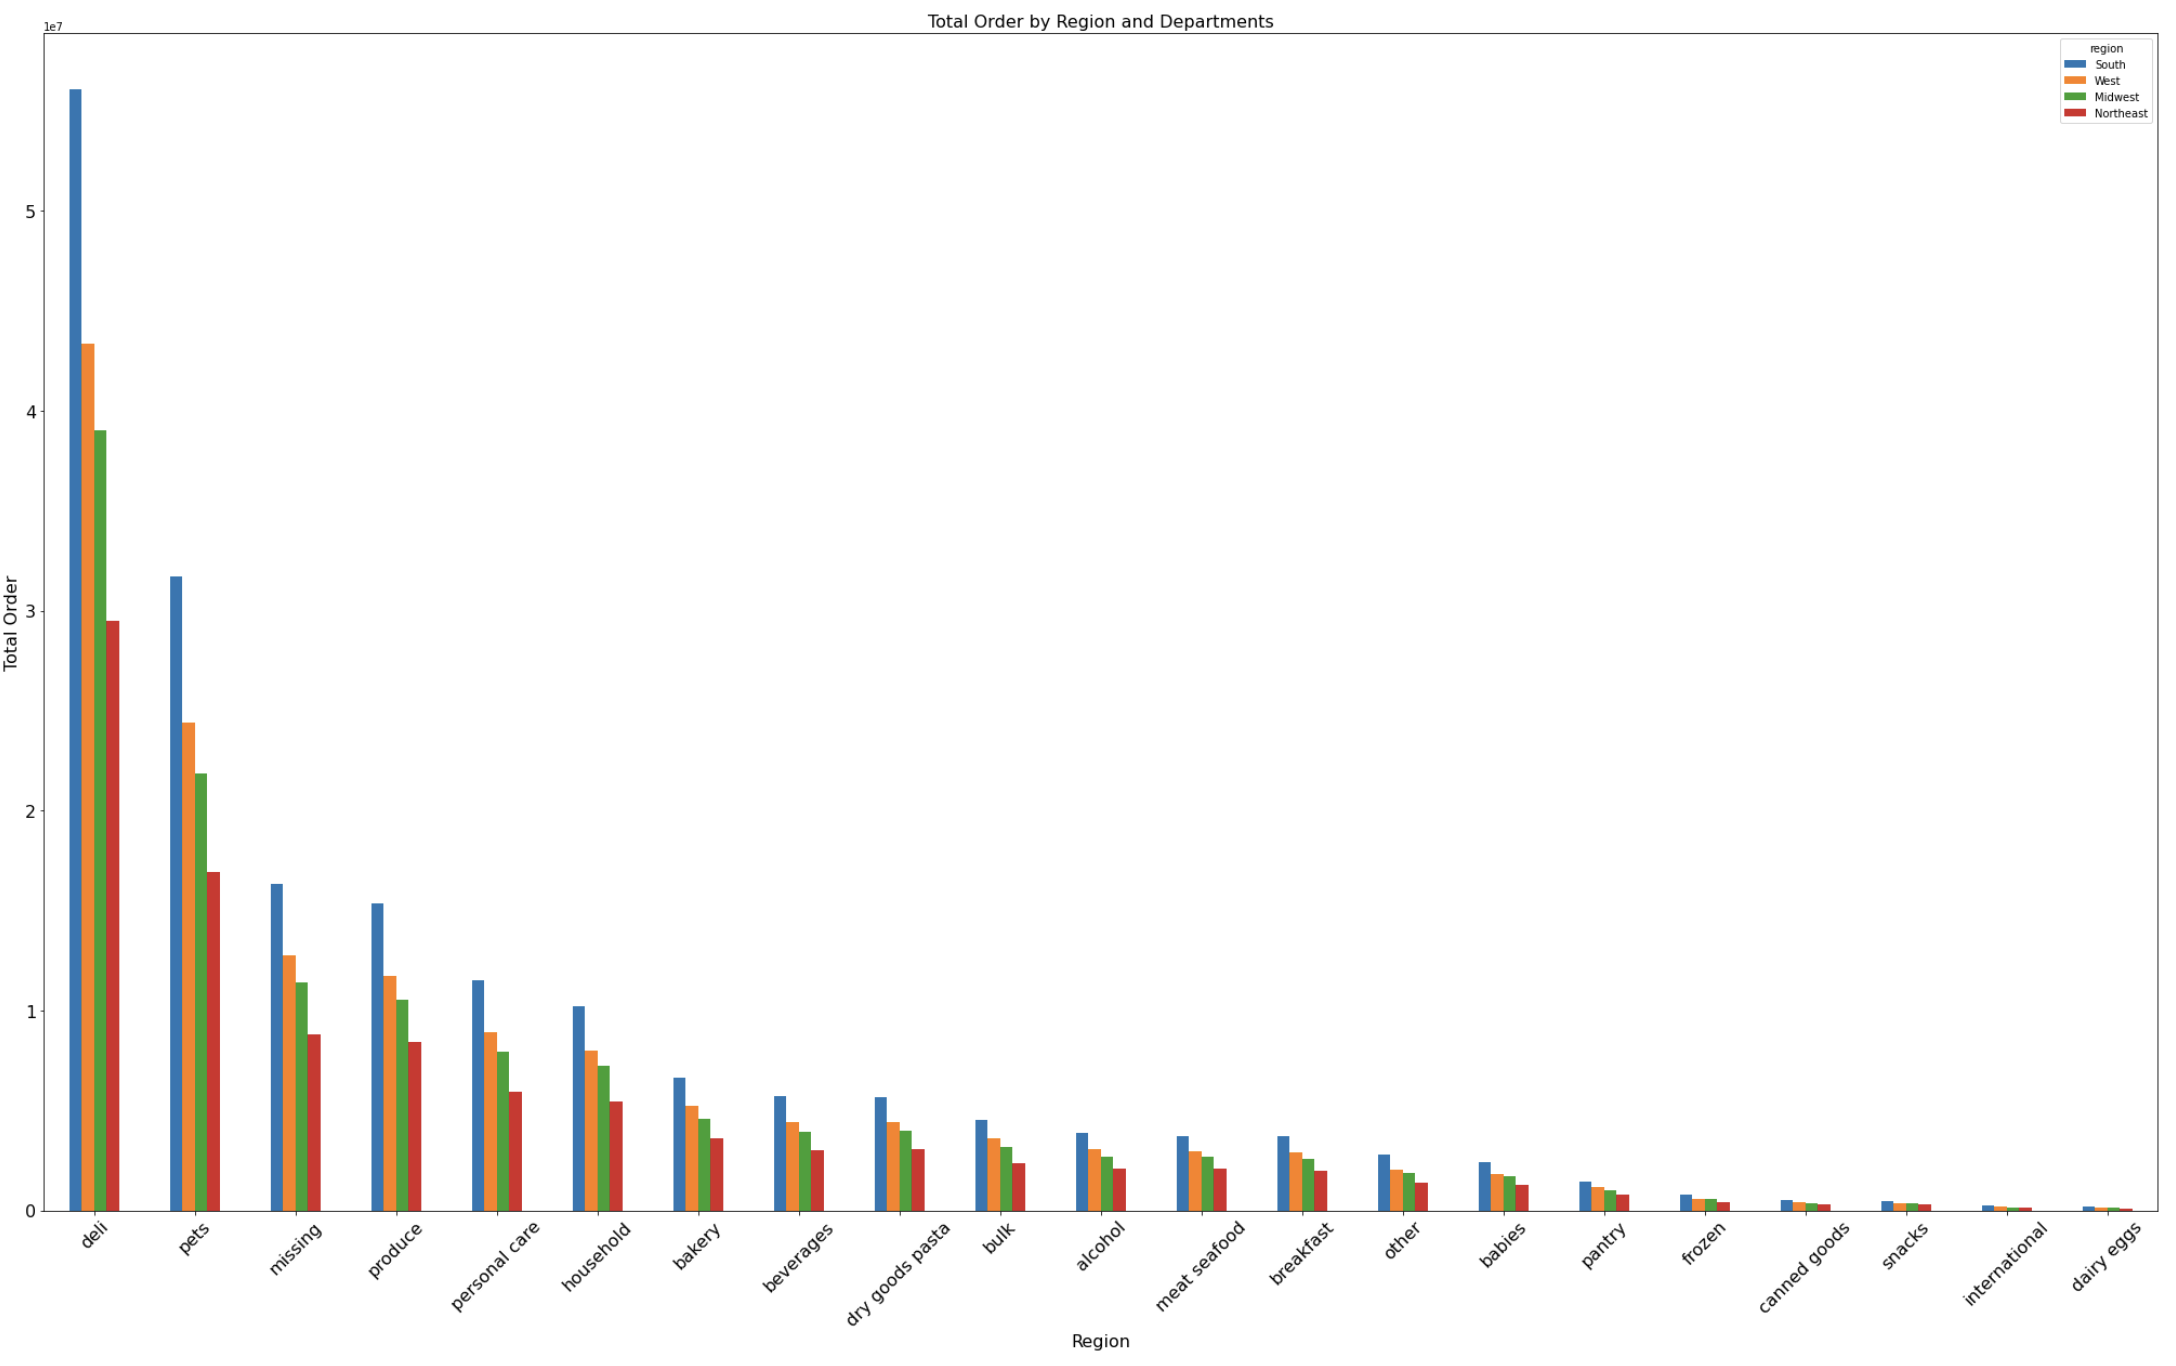
As shown by two line charts, there is no difference in terms of order time in all regions above. It has peak at early morning and at the weekend.
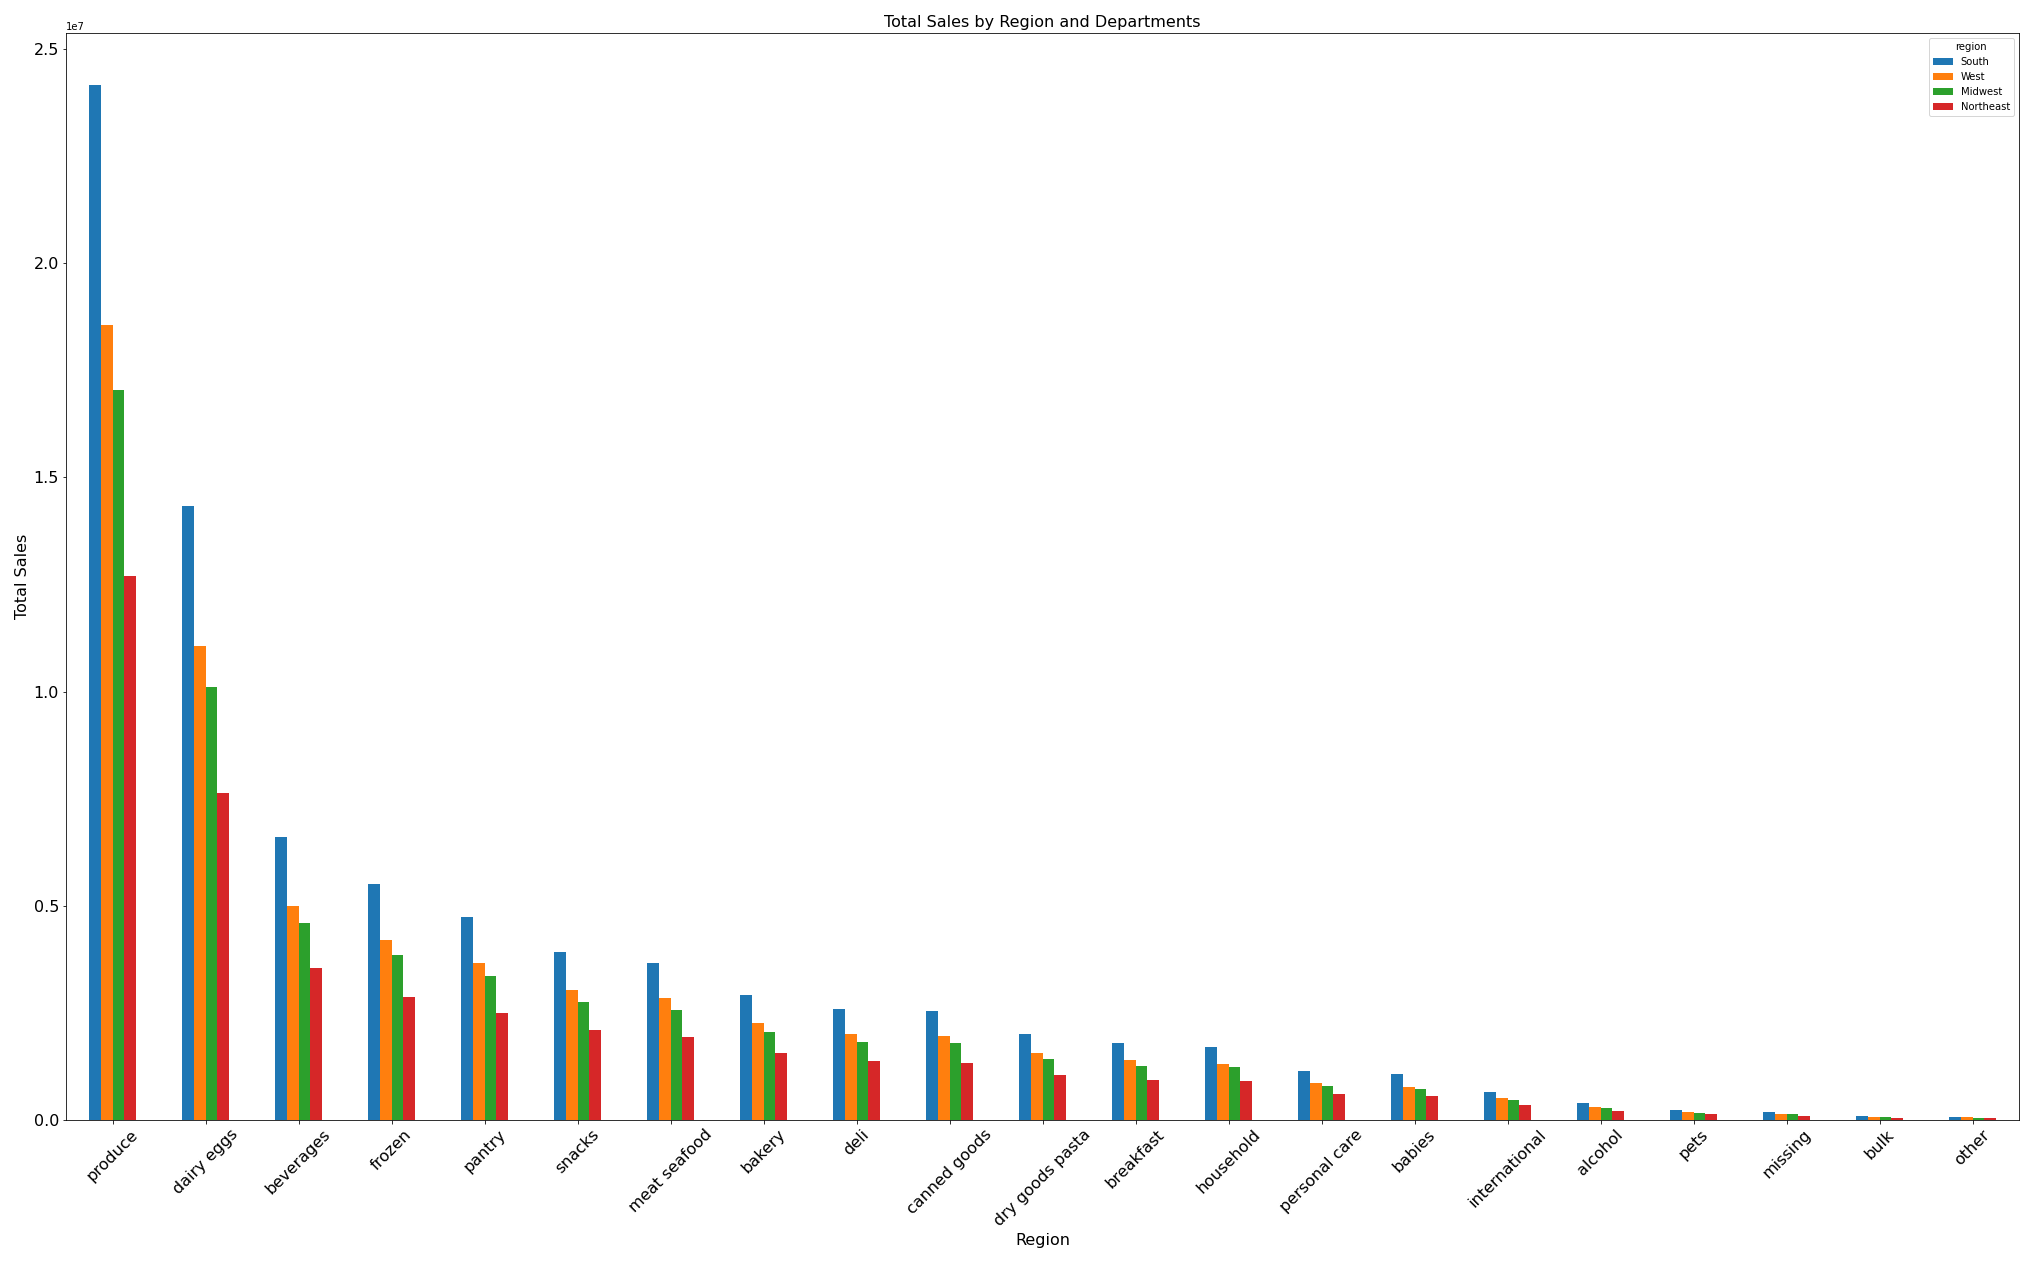
It is so surprising when total sales is broken down into region and departments. Deli department has the highest sales among other department in all regions. It is then followed by pets, missing, produce and personal care. For reference: Deli (delicatessen) is where ready-to-eat food products (such as cooked meats and prepared salads) are sold.
Recommendations:
- Ads for pets and personal care should be effectively intensified as both has rather fixed customers. For example: Pets products are of course interesting for people having pet at home.
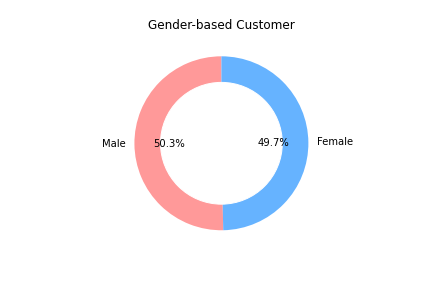
- Personal care can be easily divided into male and female groups and see the favorites among customers as Instacart has equal customers based on gender.
- Data from department labelled missing here should be gained and researched more as there is promising market.
Customer types and behavior - Ordering habits by age and family status
This analysis aims to discover if there is a connection between age and family status in terms of ordering habits.
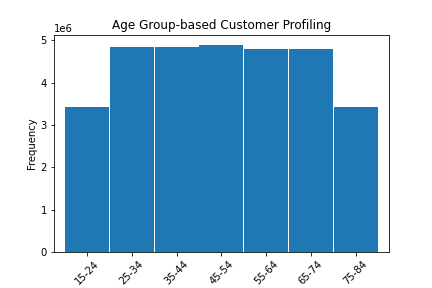
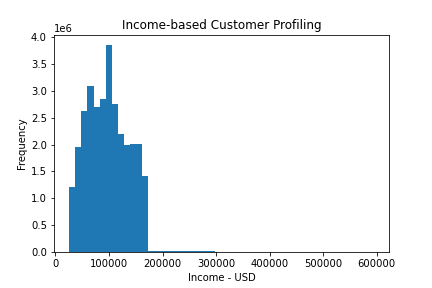
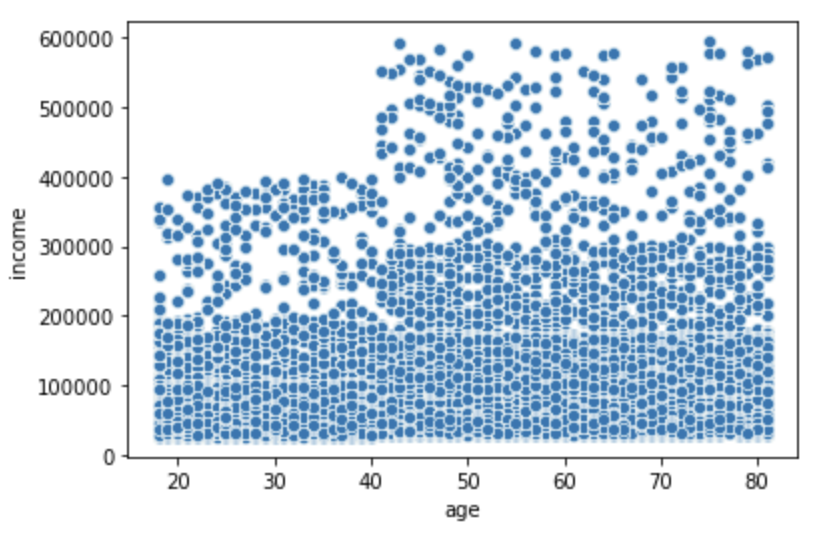
The majority of customers is from the age of 25-74 with rather equal proportion. The average income of the customers lays around $100,000. In general, income rises with age as shown by scatter plot of age vs income. Additionally, the majority age group of 20-40 years has a income range up to $200,000 and small portion of this group manage to earn up to $400,000. At the age of 41 onwards, the income of majority of this group rises up to $300,000. Small portion of thise group, however, earns higher up to $600,000.
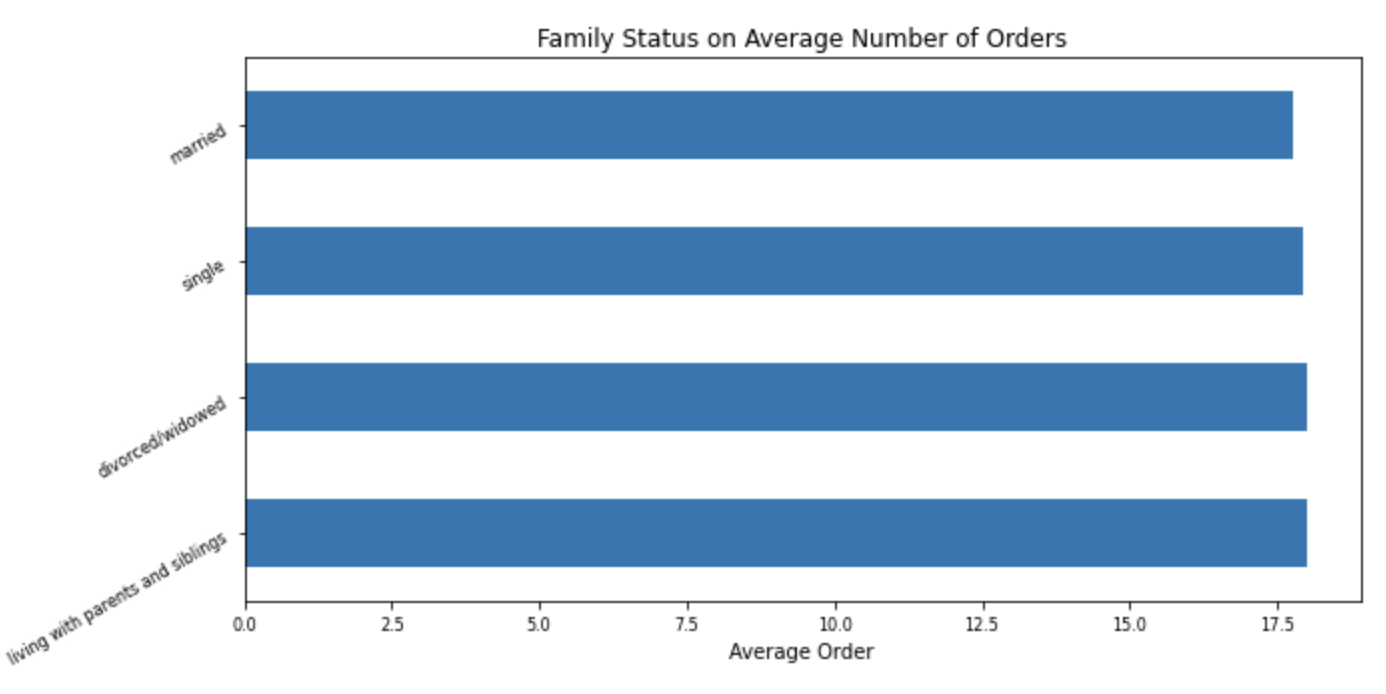
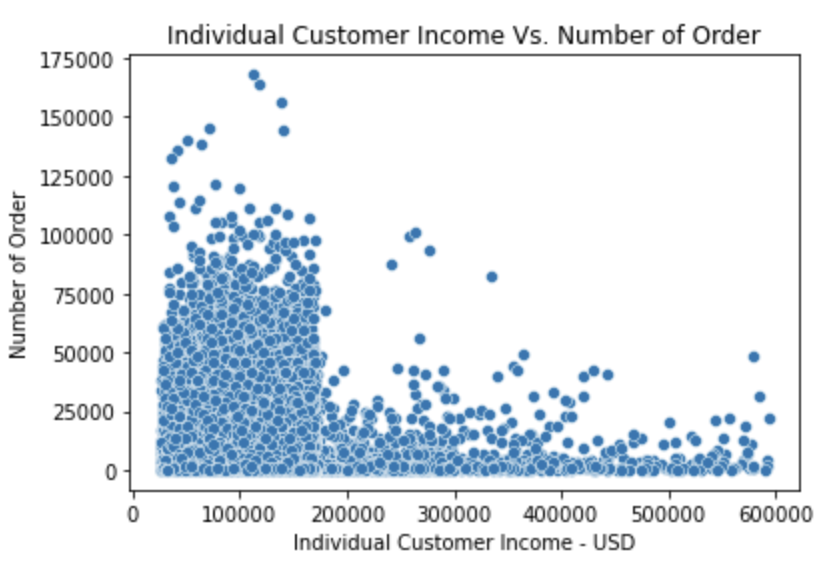
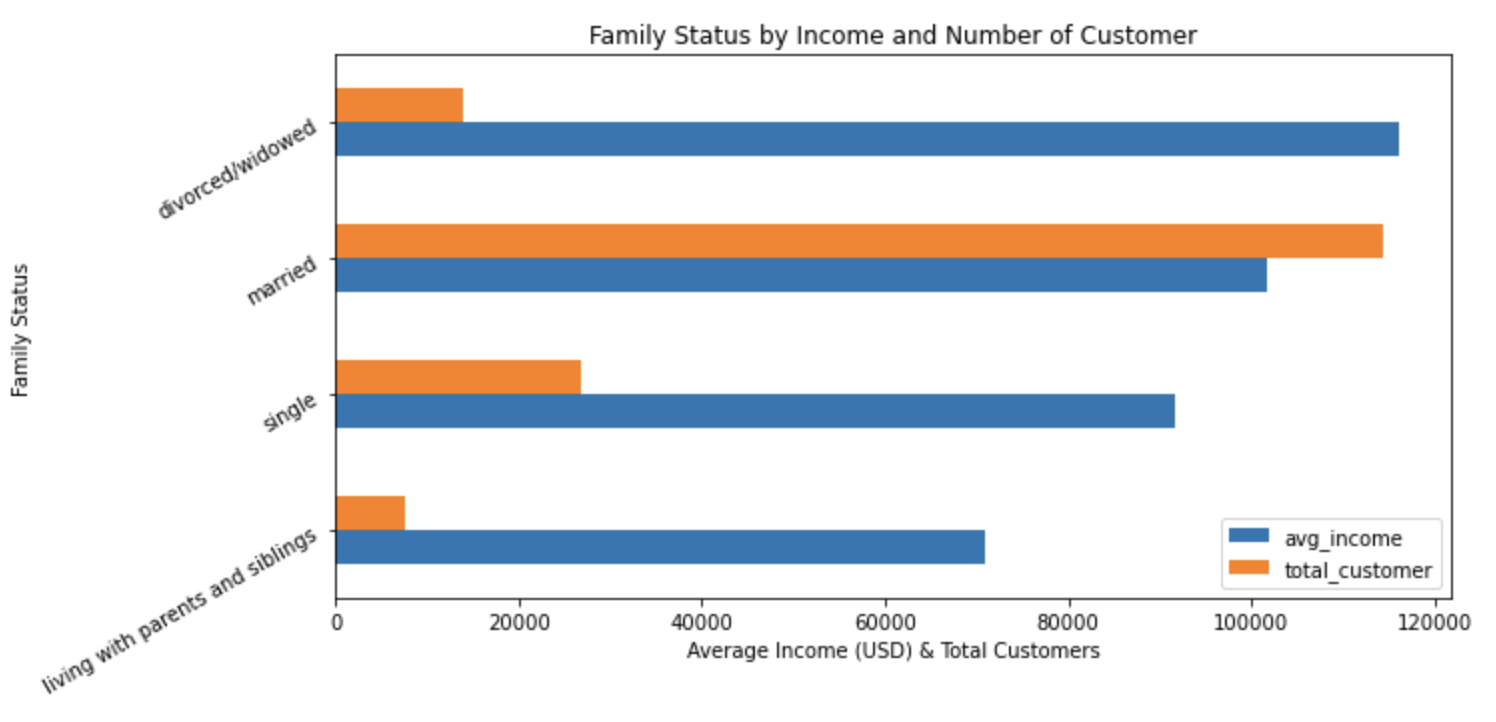
Bar chart above shows that family status does not influence the average number of orders ($17.8 - $18) that customer placed which could mean that Instacart products reach all family models. Scatter plot shows that there is no relationship between number of orders that customer placed and their corresponding income. It is however revealed, that most orders are placed by customers who earn less than $200,000. It is also linked to our previous finding that the majority of our customers have family status of married with average income of $100,000.
Recommendations:
As there is no connection between family status and income in terms of ordering habit, so ads should be targetted to each of this group individually containing their corresponding products. Ads for low and mid-range products will attracts more order traffic as most orders are placed by customers who earn less than $200,000.
Customer demographic classifications
Spender flag is calculated for each ‘user_id’ based on the average price across all their orders.
- Customer who makes order less than $10 is labbelled ‘Low spender’.
- Customer who makes order equal to or more than $10 is labbelled ‘High spender’.
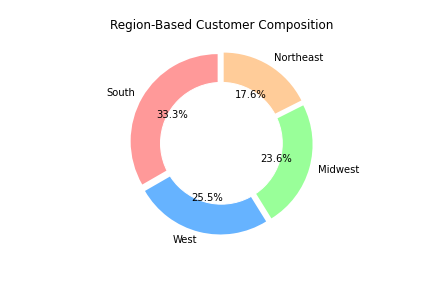
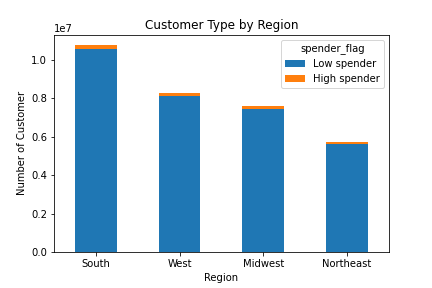
As depicted by above bar charts, we could clearly see that both high spender and low spender customers are located in the South region followed by West, Midwest and Northeast. However, as region is a group based on location, the number of states in each group may not be equal. For this purpose, let’s see how many states in each regions.
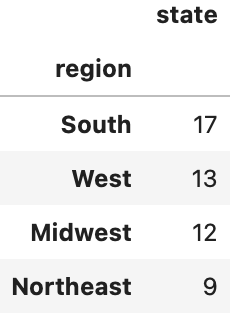
It can be clearly seen that South has the most states and therefore, also the most customers. However, in order to see how the spending behavior in the individual basis, it can be seen in the table below.
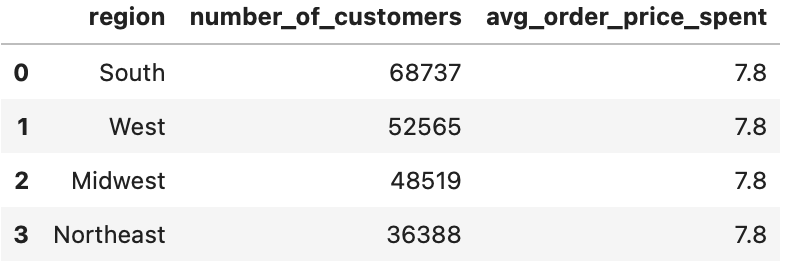
The table above shows that despite having the highest number of customers, customer in the South region does not place high value of order in average. It turns out that customer in the Midwest region places high value orders in average, despite having less number of customer.
Additionally, it was previously discussed that 3 most profitable departments are: dairy eggs, produce and beverages. It is therefore interesting to see which group of customers places those orders.
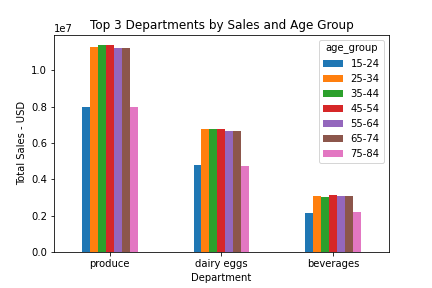
Bar chart above confirms our prior finding that the most active shoppers are customers ranging from 25-74 years of age. Bar chart below aims to discover what department obtains the most orders as it can be compared to the departments making th most profit. Does high order of products corresponds to the high profit? (see bar chart of total sales per departments and per region)
In conclusion, the popularity of certain types of goods show also a similar pattern in 4 regions (see bar chart of total sales per departments and per region). Top 3 most profitable departments are produce, dairy eggs and beverages despite medium or low order quantity. While products from deli and pets with high number of order can not beat those 3 most profitable department in terms of sales/profit.
Recommendations:
- The similar demographic pattern could make ads generally applicable.
- The adjustment in terms of ads should be considered with regard to products types and ads timing:
- Low to mid-range products should be advertised to all range of customers, particularly at minimum order period.
- High-range products ads should be targetted for customer who earns more than $200,000.
- Top 3 most profitable departments are produce, dairy eggs and beverages despite medium or low order quantity. Thus, profit can be increased if orders from these department can be increased by intensifying specific ads.
Limitations
The content of the dataset is fabricated, therefore, it does not completely reflect real situation of Instacart.
Further Analysis
As previously mentioned that age, income and family status in general do not make huge difference in terms of ordering habit. It is, thus, interesting to analyze deeper on what factor mainly triggers different ordering habit. For this purpose, more data might be required such as data from customized customer surveys.
Find the code for this analysis Github
Connect with me! Linkedin